

TRITIUM–HELIUM DATING
W. J. Jenkins, University of Southampton,
Southampton, UK
Copyright & 2001 Elsevier Ltd.
Introduction: Tritium in the Oceans
Tritium (
3 H) is the heaviest isotope of hydrogen. Its
nucleus consists of one proton (making it hydrogen)
and two neutrons. Inasmuch as it is chemically
hydrogen, tritium exists within the global environment primarily as part of the water molecule. Thus it
is a potentially useful tracer of the hydrologic cycle,
and an ideal tracer of water motions within the
ocean. Tritium is radioactive, decaying with a halflife of 12.45 years to the stable, inert daughter isotope
3 He. Because of its geologically short half-life,
there is very little natural tritium in the environment.
Small quantities are created by cosmic ray spallation
(i.e. the smashing of atomic nuclei into small fragments by high-energy cosmic rays) in the upper atmosphere. The balance between production and
radioactive decay leads to a global natural tritium
inventory of approximately 4 kg.
This natural inventory was dwarfed by the production of tritium by the atmospheric testing of nuclear fusion weapons during the 1950s and early
1960s. During this period, several hundred kilograms
of tritium were released, largely late in the test series,
and primarily in the Northern Hemisphere. The
detonations generally injected the tritium into the
stratosphere, where it was quickly oxidized to form
water vapor. Over a period of a few years, the tritiated
water vapor was transferred, largely at mid-latitudes,
to the troposphere, where it was rapidly ‘rained out’
to the earth’s surface. The delivery of bomb tritium to
the earth’s surface was monitored by a number of
WMO/IAEA (World Meteorological Organization
(UN)/International Atomic Energy Authority) precipitation sampling stations. The pattern and timing
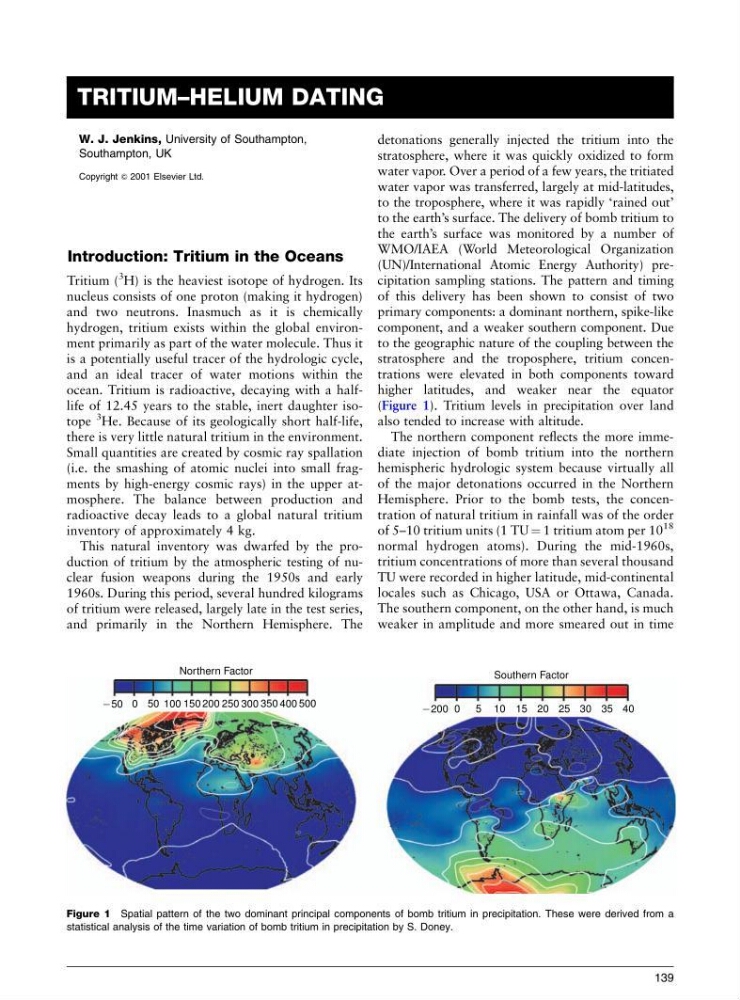
of this delivery has been shown to consist of two
primary components: a dominant northern, spike-like
component, and a weaker southern component. Due
to the geographic nature of the coupling between the
stratosphere and the troposphere, tritium concentrations were elevated in both components toward
higher latitudes, and weaker near the equator
(Figure 1). Tritium levels in precipitation over land
also tended to increase with altitude.
The northern component reflects the more immediate injection of bomb tritium into the northern
hemispheric hydrologic system because virtually all
of the major detonations occurred in the Northern
Hemisphere. Prior to the bomb tests, the concentration of natural tritium in rainfall was of the order
of 5–10 tritium units (1 TU ¼ 1 tritium atom per 10
18
normal hydrogen atoms). During the mid-1960s,
tritium concentrations of more than several thousand
TU were recorded in higher latitude, mid-continental
locales such as Chicago, USA or Ottawa, Canada.
The southern component, on the other hand, is much
weaker in amplitude and more smeared out in time
_ 50 0 50 100 150 200 250 300 350 400 500
Northern Factor
_ 200 0 5 10 15 20 25 30 35 40
Southern Factor
Figure 1 Spatial pattern of the two dominant principal components of bomb tritium in precipitation. These were derived from a
statistical analysis of the time variation of bomb tritium in precipitation by S. Doney.
139
W. J. Jenkins, University of Southampton,
Southampton, UK
Copyright & 2001 Elsevier Ltd.
Introduction: Tritium in the Oceans
Tritium (
3 H) is the heaviest isotope of hydrogen. Its
nucleus consists of one proton (making it hydrogen)
and two neutrons. Inasmuch as it is chemically
hydrogen, tritium exists within the global environment primarily as part of the water molecule. Thus it
is a potentially useful tracer of the hydrologic cycle,
and an ideal tracer of water motions within the
ocean. Tritium is radioactive, decaying with a halflife of 12.45 years to the stable, inert daughter isotope
3 He. Because of its geologically short half-life,
there is very little natural tritium in the environment.
Small quantities are created by cosmic ray spallation
(i.e. the smashing of atomic nuclei into small fragments by high-energy cosmic rays) in the upper atmosphere. The balance between production and
radioactive decay leads to a global natural tritium
inventory of approximately 4 kg.
This natural inventory was dwarfed by the production of tritium by the atmospheric testing of nuclear fusion weapons during the 1950s and early
1960s. During this period, several hundred kilograms
of tritium were released, largely late in the test series,
and primarily in the Northern Hemisphere. The
detonations generally injected the tritium into the
stratosphere, where it was quickly oxidized to form
water vapor. Over a period of a few years, the tritiated
water vapor was transferred, largely at mid-latitudes,
to the troposphere, where it was rapidly ‘rained out’
to the earth’s surface. The delivery of bomb tritium to
the earth’s surface was monitored by a number of
WMO/IAEA (World Meteorological Organization
(UN)/International Atomic Energy Authority) precipitation sampling stations. The pattern and timing
of this delivery has been shown to consist of two
primary components: a dominant northern, spike-like
component, and a weaker southern component. Due
to the geographic nature of the coupling between the
stratosphere and the troposphere, tritium concentrations were elevated in both components toward
higher latitudes, and weaker near the equator
(Figure 1). Tritium levels in precipitation over land
also tended to increase with altitude.
The northern component reflects the more immediate injection of bomb tritium into the northern
hemispheric hydrologic system because virtually all
of the major detonations occurred in the Northern
Hemisphere. Prior to the bomb tests, the concentration of natural tritium in rainfall was of the order
of 5–10 tritium units (1 TU ¼ 1 tritium atom per 10
18
normal hydrogen atoms). During the mid-1960s,
tritium concentrations of more than several thousand
TU were recorded in higher latitude, mid-continental
locales such as Chicago, USA or Ottawa, Canada.
The southern component, on the other hand, is much
weaker in amplitude and more smeared out in time
_ 50 0 50 100 150 200 250 300 350 400 500
Northern Factor
_ 200 0 5 10 15 20 25 30 35 40
Southern Factor
Figure 1 Spatial pattern of the two dominant principal components of bomb tritium in precipitation. These were derived from a
statistical analysis of the time variation of bomb tritium in precipitation by S. Doney.
139