

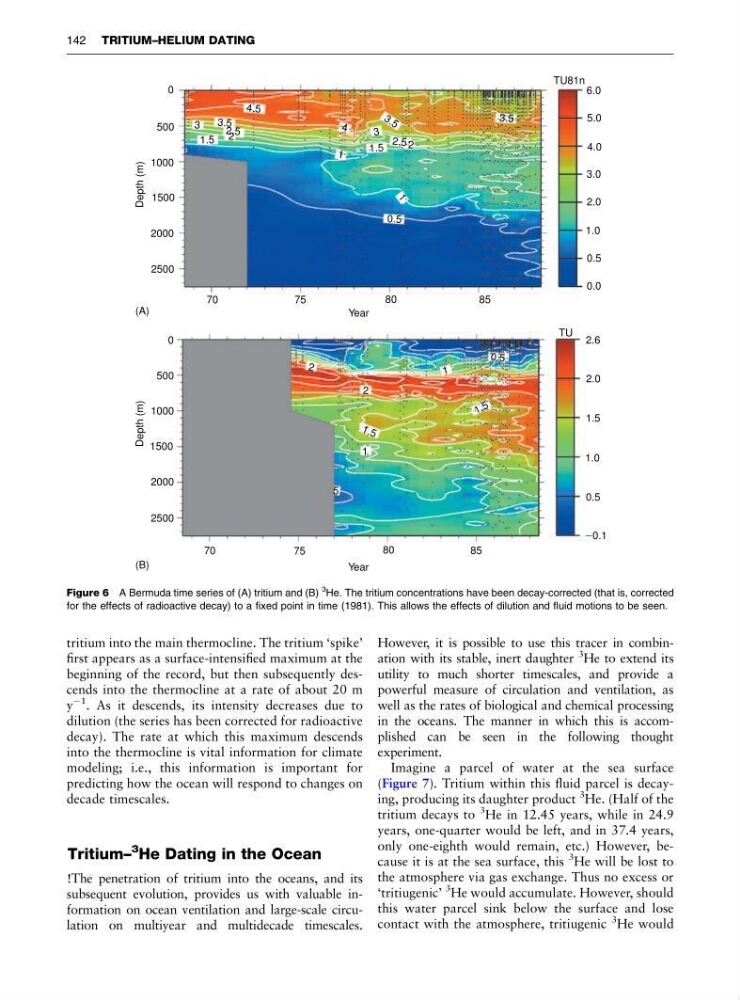
tritium into the main thermocline. The tritium ‘spike’
first appears as a surface-intensified maximum at the
beginning of the record, but then subsequently descends into the thermocline at a rate of about 20 m
y
À1 . As it descends, its intensity decreases due to
dilution (the series has been corrected for radioactive
decay). The rate at which this maximum descends
into the thermocline is vital information for climate
modeling; i.e., this information is important for
predicting how the ocean will respond to changes on
decade timescales.
Tritium–
3
He Dating in the Ocean
!The penetration of tritium into the oceans, and its
subsequent evolution, provides us with valuable information on ocean ventilation and large-scale circulation on multiyear and multidecade timescales.
However, it is possible to use this tracer in combination with its stable, inert daughter
3
He to extend its
utility to much shorter timescales, and provide a
powerful measure of circulation and ventilation, as
well as the rates of biological and chemical processing
in the oceans. The manner in which this is accomplished can be seen in the following thought
experiment.
Imagine a parcel of water at the sea surface
(Figure 7). Tritium within this fluid parcel is decaying, producing its daughter product
3
He. (Half of the
tritium decays to
3
He in 12.45 years, while in 24.9
years, one-quarter would be left, and in 37.4 years,
only one-eighth would remain, etc.) However, because it is at the sea surface, this
3
He will be lost to
the atmosphere via gas exchange. Thus no excess or
‘tritiugenic’
3
He would accumulate. However, should
this water parcel sink below the surface and lose
contact with the atmosphere, tritiugenic
3
He would
0
500
1000
1500
2000
2500
Depth (m)
70
75
80
85
Year
_ 0.1
0.5
1.0
1.5
2.0
2.6
0.5
1
1
1.5
1.5
2
2
2.5
2.5
3
3
3.5
3 . 5
3.5
4
4.5
0
500
1000
1500
2000
2500
Depth (m)
70
75
80
85
Year
0.0
0.5
1.0
2.0
3.0
4.0
5.0
6.0
TU81n
TU
0.5
1
1
1 .5
1 . 5
2
2
5
(B)
(A)
Figure 6 A Bermuda time series of (A) tritium and (B)
3 He. The tritium concentrations have been decay-corrected (that is, corrected
for the effects of radioactive decay) to a fixed point in time (1981). This allows the effects of dilution and fluid motions to be seen.
142 TRITIUM–HELIUM DATING
first appears as a surface-intensified maximum at the
beginning of the record, but then subsequently descends into the thermocline at a rate of about 20 m
y
À1 . As it descends, its intensity decreases due to
dilution (the series has been corrected for radioactive
decay). The rate at which this maximum descends
into the thermocline is vital information for climate
modeling; i.e., this information is important for
predicting how the ocean will respond to changes on
decade timescales.
Tritium–
3
He Dating in the Ocean
!The penetration of tritium into the oceans, and its
subsequent evolution, provides us with valuable information on ocean ventilation and large-scale circulation on multiyear and multidecade timescales.
However, it is possible to use this tracer in combination with its stable, inert daughter
3
He to extend its
utility to much shorter timescales, and provide a
powerful measure of circulation and ventilation, as
well as the rates of biological and chemical processing
in the oceans. The manner in which this is accomplished can be seen in the following thought
experiment.
Imagine a parcel of water at the sea surface
(Figure 7). Tritium within this fluid parcel is decaying, producing its daughter product
3
He. (Half of the
tritium decays to
3
He in 12.45 years, while in 24.9
years, one-quarter would be left, and in 37.4 years,
only one-eighth would remain, etc.) However, because it is at the sea surface, this
3
He will be lost to
the atmosphere via gas exchange. Thus no excess or
‘tritiugenic’
3
He would accumulate. However, should
this water parcel sink below the surface and lose
contact with the atmosphere, tritiugenic
3
He would
0
500
1000
1500
2000
2500
Depth (m)
70
75
80
85
Year
_ 0.1
0.5
1.0
1.5
2.0
2.6
0.5
1
1
1.5
1.5
2
2
2.5
2.5
3
3
3.5
3 . 5
3.5
4
4.5
0
500
1000
1500
2000
2500
Depth (m)
70
75
80
85
Year
0.0
0.5
1.0
2.0
3.0
4.0
5.0
6.0
TU81n
TU
0.5
1
1
1 .5
1 . 5
2
2
5
(B)
(A)
Figure 6 A Bermuda time series of (A) tritium and (B)
3 He. The tritium concentrations have been decay-corrected (that is, corrected
for the effects of radioactive decay) to a fixed point in time (1981). This allows the effects of dilution and fluid motions to be seen.
142 TRITIUM–HELIUM DATING