

unique ages cannot be assigned. For example, the
slope in
87
Sr/
86
Sr in the Early Tertiary period is too
low to allow for high-resolution stratigraphy.
The changes in the
87 Sr/
86 Sr ratio are controlled by
several processes. These are (1) the mid-ocean ridge
flux, which is in turn controlled by the spreading
rates of the seafloor; (2) the rate of chemical weathering, in particular that of feldspar and calcite;
(3) the areal extent of the continents above sea level;
(4) changes in the carbonate compensation depth
(CCD). Seawater Sr isotope ratios vary within a
small range over time. This is because of the long and
efficient mixing of Sr, and also because dissolution of
continental carbonate buffers seawater Sr isotope
compositions within a narrow range.
Some of the trends visible in Figure 3 are a relatively slow decrease in
87
Sr/
86
Sr ratios from the
Cambrian to the Jurassic period, upon which are
superimposed a number of relatively large fluctuations. The sharp decline and following rise at the
Permian/Triassic boundary are spectacular, and are
thought to reflect either an extreme climate and
weathering change, or the sudden mixing of a
previously stratified ocean. A second main trend is a
relatively rapid increase in
87 Sr/
86 Sr ratios from the
Jurassic to the present, upon which a number of
relatively small fluctuations are superimposed.
Much discussion has been stimulated by the strong
Cenozoic increase in
87 Sr/
86
Sr (Figure 4) that has
been linked by some workers to the uplift of the
Himalayas and the ensuing delivery of high
87 Sr/
86 Sr
by Himalayan rivers. This view was challenged by
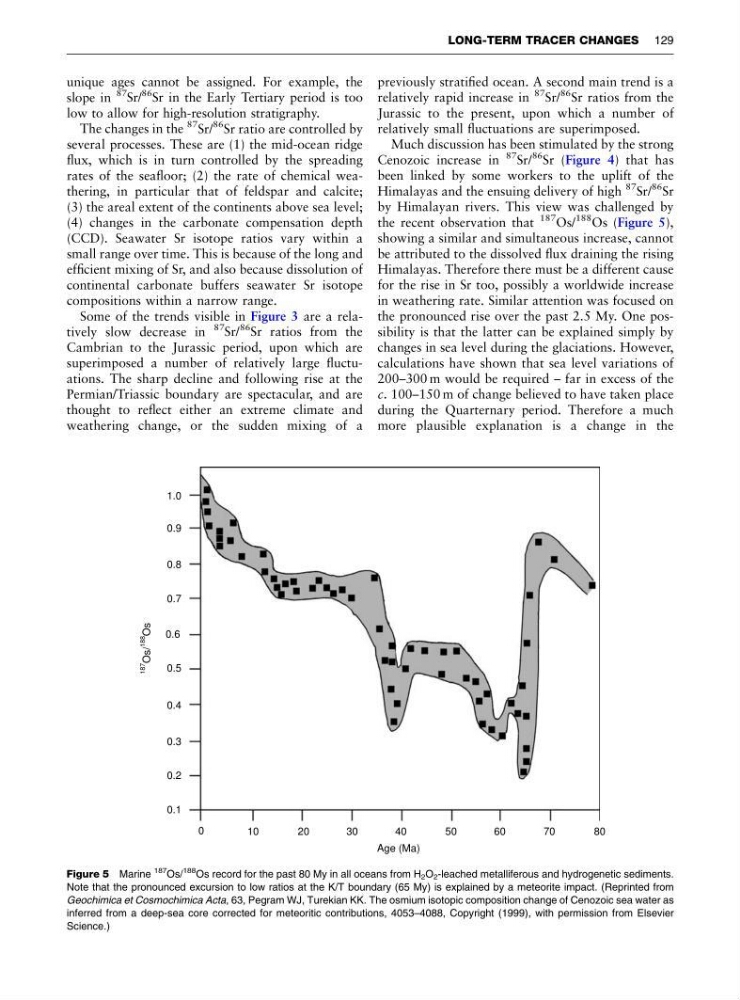
the recent observation that
187 Os/
188 Os (Figure 5),
showing a similar and simultaneous increase, cannot
be attributed to the dissolved flux draining the rising
Himalayas. Therefore there must be a different cause
for the rise in Sr too, possibly a worldwide increase
in weathering rate. Similar attention was focused on
the pronounced rise over the past 2.5 My. One possibility is that the latter can be explained simply by
changes in sea level during the glaciations. However,
calculations have shown that sea level variations of
200–300 m would be required – far in excess of the
c. 100–150 m of change believed to have taken place
during the Quarternary period. Therefore a much
more plausible explanation is a change in the
1.0
0.9
0.8
0.7
0.6
0.5
0.4
0.3
0.2
0.1
187
Os/
188
Os
0
10
20
30
40
Age (Ma)
50
60
70
80
Figure 5 Marine
187
Os/
188 Os record for the past 80 My in all oceans from H 2 O 2 -leached metalliferous and hydrogenetic sediments.
Note that the pronounced excursion to low ratios at the K/T boundary (65 My) is explained by a meteorite impact. (Reprinted from
Geochimica et Cosmochimica Acta, 63, Pegram WJ, Turekian KK. The osmium isotopic composition change of Cenozoic sea water as
inferred from a deep-sea core corrected for meteoritic contributions, 4053–4088, Copyright (1999), with permission from Elsevier
Science.)
LONG-TERM TRACER CHANGES 129
slope in
87
Sr/
86
Sr in the Early Tertiary period is too
low to allow for high-resolution stratigraphy.
The changes in the
87 Sr/
86 Sr ratio are controlled by
several processes. These are (1) the mid-ocean ridge
flux, which is in turn controlled by the spreading
rates of the seafloor; (2) the rate of chemical weathering, in particular that of feldspar and calcite;
(3) the areal extent of the continents above sea level;
(4) changes in the carbonate compensation depth
(CCD). Seawater Sr isotope ratios vary within a
small range over time. This is because of the long and
efficient mixing of Sr, and also because dissolution of
continental carbonate buffers seawater Sr isotope
compositions within a narrow range.
Some of the trends visible in Figure 3 are a relatively slow decrease in
87
Sr/
86
Sr ratios from the
Cambrian to the Jurassic period, upon which are
superimposed a number of relatively large fluctuations. The sharp decline and following rise at the
Permian/Triassic boundary are spectacular, and are
thought to reflect either an extreme climate and
weathering change, or the sudden mixing of a
previously stratified ocean. A second main trend is a
relatively rapid increase in
87 Sr/
86 Sr ratios from the
Jurassic to the present, upon which a number of
relatively small fluctuations are superimposed.
Much discussion has been stimulated by the strong
Cenozoic increase in
87 Sr/
86
Sr (Figure 4) that has
been linked by some workers to the uplift of the
Himalayas and the ensuing delivery of high
87 Sr/
86 Sr
by Himalayan rivers. This view was challenged by
the recent observation that
187 Os/
188 Os (Figure 5),
showing a similar and simultaneous increase, cannot
be attributed to the dissolved flux draining the rising
Himalayas. Therefore there must be a different cause
for the rise in Sr too, possibly a worldwide increase
in weathering rate. Similar attention was focused on
the pronounced rise over the past 2.5 My. One possibility is that the latter can be explained simply by
changes in sea level during the glaciations. However,
calculations have shown that sea level variations of
200–300 m would be required – far in excess of the
c. 100–150 m of change believed to have taken place
during the Quarternary period. Therefore a much
more plausible explanation is a change in the
1.0
0.9
0.8
0.7
0.6
0.5
0.4
0.3
0.2
0.1
187
Os/
188
Os
0
10
20
30
40
Age (Ma)
50
60
70
80
Figure 5 Marine
187
Os/
188 Os record for the past 80 My in all oceans from H 2 O 2 -leached metalliferous and hydrogenetic sediments.
Note that the pronounced excursion to low ratios at the K/T boundary (65 My) is explained by a meteorite impact. (Reprinted from
Geochimica et Cosmochimica Acta, 63, Pegram WJ, Turekian KK. The osmium isotopic composition change of Cenozoic sea water as
inferred from a deep-sea core corrected for meteoritic contributions, 4053–4088, Copyright (1999), with permission from Elsevier
Science.)
LONG-TERM TRACER CHANGES 129