

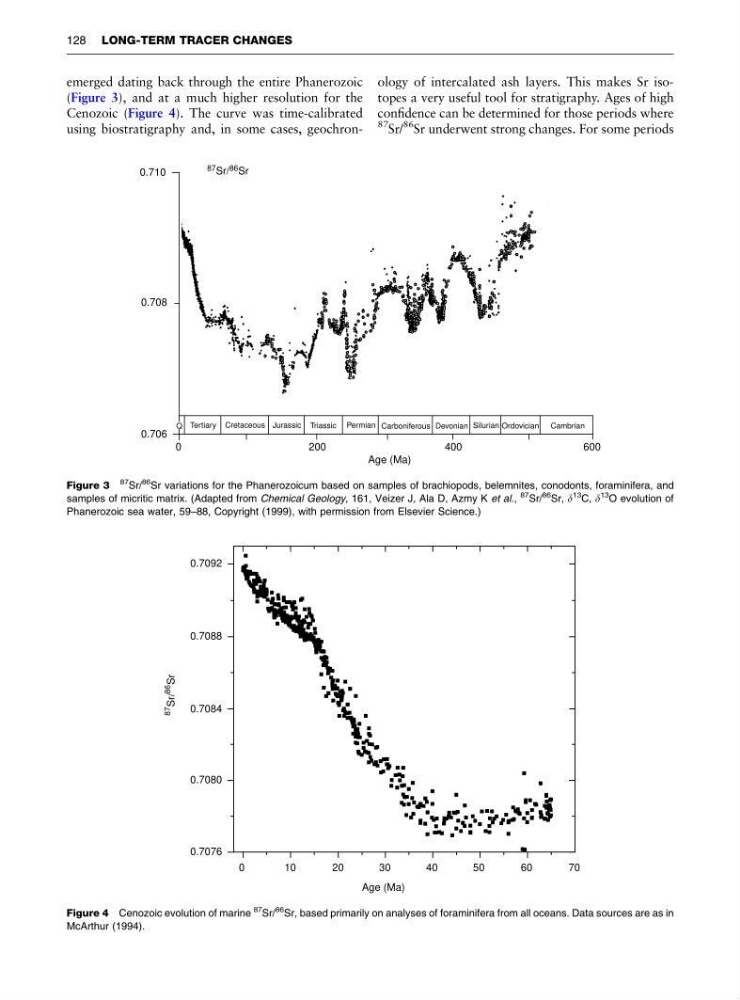
emerged dating back through the entire Phanerozoic
(Figure 3), and at a much higher resolution for the
Cenozoic (Figure 4). The curve was time-calibrated
using biostratigraphy and, in some cases, geochronology of intercalated ash layers. This makes Sr isotopes a very useful tool for stratigraphy. Ages of high
confidence can be determined for those periods where
87
Sr/
86
Sr underwent strong changes. For some periods
87 Sr/ 86 Sr
0.710
0.708
0.706
0
200
400
600
Age (Ma)
Tertiary
Q
Cretaceous Jurassic Triassic Permian Carboniferous Devonian Silurian Ordovician Cambrian
Figure 3
87
Sr/
86 Sr variations for the Phanerozoicum based on samples of brachiopods, belemnites, conodonts, foraminifera, and
samples of micritic matrix. (Adapted from Chemical Geology, 161, Veizer J, Ala D, Azmy K et al.,
87 Sr/
86 Sr, d
13 C, d
13
O evolution of
Phanerozoic sea water, 59–88, Copyright (1999), with permission from Elsevier Science.)
0.7092
0.7088
0.7084
0.7080
0
1 0
2 0
3 0
Age (Ma)
40
50
60
70
87
Sr/
86
Sr
0.7076
Figure 4 Cenozoic evolution of marine
87
Sr/
86 Sr, based primarily on analyses of foraminifera from all oceans. Data sources are as in
McArthur (1994).
128 LONG-TERM TRACER CHANGES
(Figure 3), and at a much higher resolution for the
Cenozoic (Figure 4). The curve was time-calibrated
using biostratigraphy and, in some cases, geochronology of intercalated ash layers. This makes Sr isotopes a very useful tool for stratigraphy. Ages of high
confidence can be determined for those periods where
87
Sr/
86
Sr underwent strong changes. For some periods
87 Sr/ 86 Sr
0.710
0.708
0.706
0
200
400
600
Age (Ma)
Tertiary
Q
Cretaceous Jurassic Triassic Permian Carboniferous Devonian Silurian Ordovician Cambrian
Figure 3
87
Sr/
86 Sr variations for the Phanerozoicum based on samples of brachiopods, belemnites, conodonts, foraminifera, and
samples of micritic matrix. (Adapted from Chemical Geology, 161, Veizer J, Ala D, Azmy K et al.,
87 Sr/
86 Sr, d
13 C, d
13
O evolution of
Phanerozoic sea water, 59–88, Copyright (1999), with permission from Elsevier Science.)
0.7092
0.7088
0.7084
0.7080
0
1 0
2 0
3 0
Age (Ma)
40
50
60
70
87
Sr/
86
Sr
0.7076
Figure 4 Cenozoic evolution of marine
87
Sr/
86 Sr, based primarily on analyses of foraminifera from all oceans. Data sources are as in
McArthur (1994).
128 LONG-TERM TRACER CHANGES