

sediment -1 ) were recorded 0-10 mm depth horizon during the summer when the sediments were warmest ( 19°C) and lowest during the winter (mean temperature 4.5°C). Little
correlation was observed between population densities of nitrifying bacteria (Table 2) and
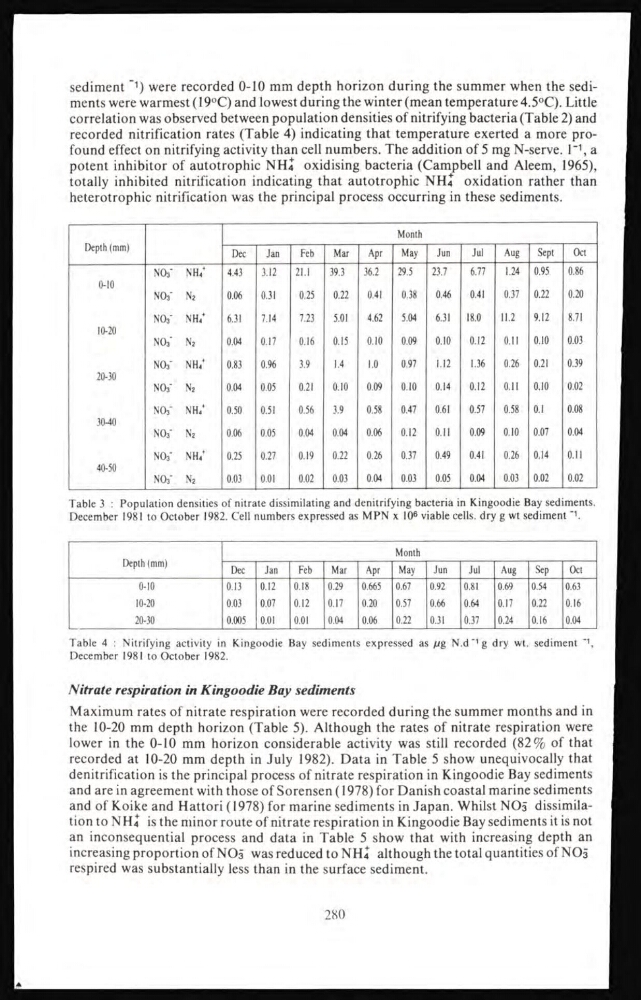
recorded nitrification rates (Table 4) indicating that temperature exerted a more profound effect on nitrifying activity than cell numbers. The addition of 5 mg N-serve. 1 -1 , a
potent inhibitor of autotrophic NH +
4
oxidising bacteria (Campbell and Aleem, 1965),
totally inhibited nitrification indicating that autotrophic NH4 oxidation rather than
heterotrophic nitrification was the principal process occurring in these sediments.
Depth (mm)
Month
Dec
Jan
Feb
Mar
Apr
May
Jun
Jul
Aug
Sept
Oct
NOT NH
+
4
4.43
3.12
21.1
39.3
36.2
29.5
23.7
6.77
1.24 0.95
0.86
0-10
NOT N 2
0.06
0.31
0.25
0.22
0.41
0.38
0.46
0.41
0.37 0.22
0.20
NOT NH
4
+
6.31
7.14
7.23
5.01
4.62
5.04
6.31
18.0
11.2
9.12
8.71
10-20
NOT N 2
0.04
0.17
0.16
0.15
0.10
0.09
0.10
0.12
0.11
0.10
0.03
NOT NH +
4
0.83
0.96
3.9
1.4
1.0
0.97
1.12
1.36
0.26 0.21
0.39
20-30
NOT N 2
0.04
0.05
0.21
0.10
0.09
0.10
0.14
0.12
0.11 0.10
0.02
NOT NHT
0.50
0.51
0.56
3.9
0.58
0.47
0.61
0.57
0.58 0.1
0.08
30-40
NOT N 2
0.06
0.05
0.04
0.04
0.06
0.12
0.11
0.09
0.10 0.07
0.04
NOT NH +
4
0.25
0.27
0.19
0.22
0.26
0.37
0.49
0.41
0.26 0.14
0.11
40-50
NOT N 2
0.03
0.01
0.02
0.03
0.04
0.03
0.05
0.04
0.03 0.02
0.02
Table 3 : Population densities of nitrate dissimilating and denitrifying bacteria in Kingoodie Bay sediments.
December 1981 to October 1982. Cell numbers expressed as MPN x 10 6 viable cells. dry g wt sediment -1 .
Depth (mm)
Month
Dec
Jan
Feb
Mar
Apr
May
Jun
Jul
Aug
Sep
Oct
0-10
0.13
0.12
0.18
0.29
0.665 0.67
0.92
0.81
0.69
0.54
0.63
10-20
0.03
0.07
0.12
0.17
0.20
0.57
0.66
0.64
0.17
0.22
0.16
20-30
0.005 0.01
0.01
0.04
0.06
0.22
0.31
0.37
0.24
0.16
0.04
Table 4 : Nitrifying activity in Kingoodie Bay sediments expressed as µg N.d -1 g dry wt. sediment -1 ,
December 1981 to October 1982.
Nitrate respiration in Kingoodie Bay sediments
Maximum rates of nitrate respiration were recorded during the summer months and in
the 10-20 mm depth horizon (Table 5). Although the rates of nitrate respiration were
lower in the 0-10 mm horizon considerable activity was still recorded (82% of that
recorded at 10-20 mm depth in July 1982). Data in Table 5 show unequivocally that
denitrification is the principal process of nitrate respiration in Kingoodie Bay sediments
and are in agreement with those of Sorensen ( 1978) for Danish coastal marine sediments
and of Koike and Hattori ( 1978) for marine sediments in Japan. Whilst NO3 dissimilation to NH4 is the minor route of nitrate respiration in Kingoodie Bay sediments it is not
an inconsequential process and data in Table 5 show that with increasing depth an
increasing proportion of NO -
3 was reduced to NH +
4 although the total quantities of NO -
3
respired was substantially less than in the surface sediment.
280
correlation was observed between population densities of nitrifying bacteria (Table 2) and
recorded nitrification rates (Table 4) indicating that temperature exerted a more profound effect on nitrifying activity than cell numbers. The addition of 5 mg N-serve. 1 -1 , a
potent inhibitor of autotrophic NH +
4
oxidising bacteria (Campbell and Aleem, 1965),
totally inhibited nitrification indicating that autotrophic NH4 oxidation rather than
heterotrophic nitrification was the principal process occurring in these sediments.
Depth (mm)
Month
Dec
Jan
Feb
Mar
Apr
May
Jun
Jul
Aug
Sept
Oct
NOT NH
+
4
4.43
3.12
21.1
39.3
36.2
29.5
23.7
6.77
1.24 0.95
0.86
0-10
NOT N 2
0.06
0.31
0.25
0.22
0.41
0.38
0.46
0.41
0.37 0.22
0.20
NOT NH
4
+
6.31
7.14
7.23
5.01
4.62
5.04
6.31
18.0
11.2
9.12
8.71
10-20
NOT N 2
0.04
0.17
0.16
0.15
0.10
0.09
0.10
0.12
0.11
0.10
0.03
NOT NH +
4
0.83
0.96
3.9
1.4
1.0
0.97
1.12
1.36
0.26 0.21
0.39
20-30
NOT N 2
0.04
0.05
0.21
0.10
0.09
0.10
0.14
0.12
0.11 0.10
0.02
NOT NHT
0.50
0.51
0.56
3.9
0.58
0.47
0.61
0.57
0.58 0.1
0.08
30-40
NOT N 2
0.06
0.05
0.04
0.04
0.06
0.12
0.11
0.09
0.10 0.07
0.04
NOT NH +
4
0.25
0.27
0.19
0.22
0.26
0.37
0.49
0.41
0.26 0.14
0.11
40-50
NOT N 2
0.03
0.01
0.02
0.03
0.04
0.03
0.05
0.04
0.03 0.02
0.02
Table 3 : Population densities of nitrate dissimilating and denitrifying bacteria in Kingoodie Bay sediments.
December 1981 to October 1982. Cell numbers expressed as MPN x 10 6 viable cells. dry g wt sediment -1 .
Depth (mm)
Month
Dec
Jan
Feb
Mar
Apr
May
Jun
Jul
Aug
Sep
Oct
0-10
0.13
0.12
0.18
0.29
0.665 0.67
0.92
0.81
0.69
0.54
0.63
10-20
0.03
0.07
0.12
0.17
0.20
0.57
0.66
0.64
0.17
0.22
0.16
20-30
0.005 0.01
0.01
0.04
0.06
0.22
0.31
0.37
0.24
0.16
0.04
Table 4 : Nitrifying activity in Kingoodie Bay sediments expressed as µg N.d -1 g dry wt. sediment -1 ,
December 1981 to October 1982.
Nitrate respiration in Kingoodie Bay sediments
Maximum rates of nitrate respiration were recorded during the summer months and in
the 10-20 mm depth horizon (Table 5). Although the rates of nitrate respiration were
lower in the 0-10 mm horizon considerable activity was still recorded (82% of that
recorded at 10-20 mm depth in July 1982). Data in Table 5 show unequivocally that
denitrification is the principal process of nitrate respiration in Kingoodie Bay sediments
and are in agreement with those of Sorensen ( 1978) for Danish coastal marine sediments
and of Koike and Hattori ( 1978) for marine sediments in Japan. Whilst NO3 dissimilation to NH4 is the minor route of nitrate respiration in Kingoodie Bay sediments it is not
an inconsequential process and data in Table 5 show that with increasing depth an
increasing proportion of NO -
3 was reduced to NH +
4 although the total quantities of NO -
3
respired was substantially less than in the surface sediment.
280