

uptake (106 fg glucose/cell)
Reaction time
Free cells
Attached cells
10s
24
173
30 s
121
281
2mn
190
785
10 mn
697
2456
30 mn
1187
4771
Table 2 : Uptake of glucose by free and attached cells of E. cloacae.
3 H-glucose was added at a final concentrat ion of 1.25 ng/ml. Total adherent cells per coverslip = 6.2 x 10
7 . Total
free cell population assayed was 6.0 x 10
7 .
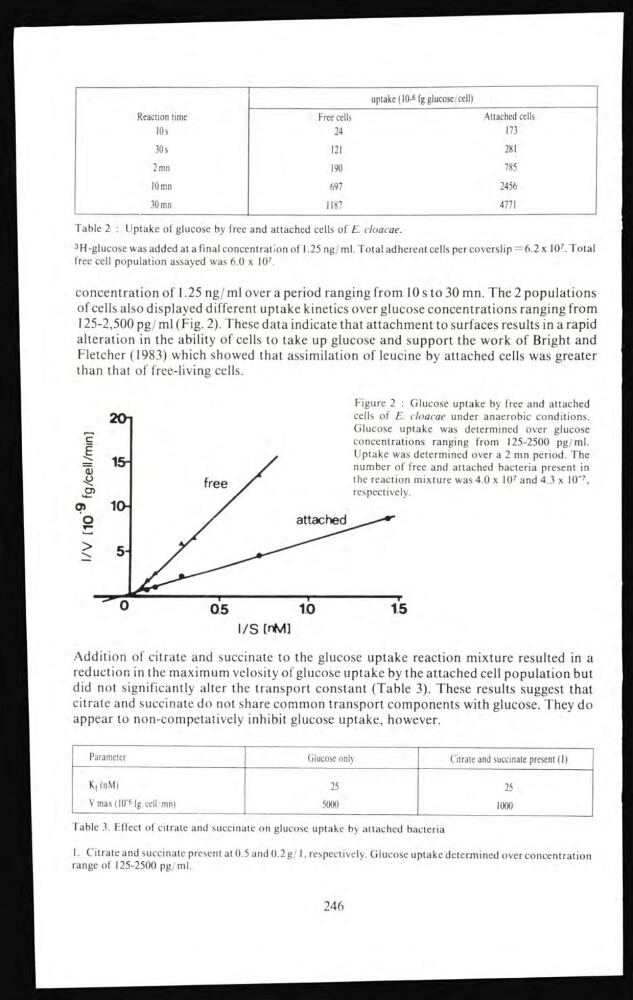
concentration of 1.25 ng/ ml over a period ranging from 10 s to 30 mn. The 2 populations
of cells also displayed different uptake kinetics over glucose concentrations ranging from
125-2,500 pg/ ml (Fig. 2). These data indicate that attachment to surfaces results in a rapid
alteration in the ability of cells to take up glucose and support the work of Bright and
Fletcher (1983) which showed that assimilation of leucine by attached cells was greater
than that of free-living cells.
Figure 2 : Glucose uptake by free and attached
Addition of citrate and succinate to the glucose uptake reaction mixture resulted in a
reduction in the maximum velosity of glucose uptake by the attached cell population but
did not significantly alter the transport constant (Table 3). These results suggest that
citrate and succinate do not share common transport components with glucose. They do
appear to non-competatively inhibit glucose uptake, however.
Parameter
Glucose only
Citrate and succinate present (1)
K t (nM)
25
25
V max (10'
6 fg/ cell mn)
5000
1000
Table 3. Effect of citrate and succinate on glucose uptake by attached bacteria
I. Citrate and succinate present at 0.5 and 0.2 g/1, respectively. Glucose uptake determined over concentration
range of 125-2500 pg/ml.
246
Reaction time
Free cells
Attached cells
10s
24
173
30 s
121
281
2mn
190
785
10 mn
697
2456
30 mn
1187
4771
Table 2 : Uptake of glucose by free and attached cells of E. cloacae.
3 H-glucose was added at a final concentrat ion of 1.25 ng/ml. Total adherent cells per coverslip = 6.2 x 10
7 . Total
free cell population assayed was 6.0 x 10
7 .
concentration of 1.25 ng/ ml over a period ranging from 10 s to 30 mn. The 2 populations
of cells also displayed different uptake kinetics over glucose concentrations ranging from
125-2,500 pg/ ml (Fig. 2). These data indicate that attachment to surfaces results in a rapid
alteration in the ability of cells to take up glucose and support the work of Bright and
Fletcher (1983) which showed that assimilation of leucine by attached cells was greater
than that of free-living cells.
Figure 2 : Glucose uptake by free and attached
Addition of citrate and succinate to the glucose uptake reaction mixture resulted in a
reduction in the maximum velosity of glucose uptake by the attached cell population but
did not significantly alter the transport constant (Table 3). These results suggest that
citrate and succinate do not share common transport components with glucose. They do
appear to non-competatively inhibit glucose uptake, however.
Parameter
Glucose only
Citrate and succinate present (1)
K t (nM)
25
25
V max (10'
6 fg/ cell mn)
5000
1000
Table 3. Effect of citrate and succinate on glucose uptake by attached bacteria
I. Citrate and succinate present at 0.5 and 0.2 g/1, respectively. Glucose uptake determined over concentration
range of 125-2500 pg/ml.
246