

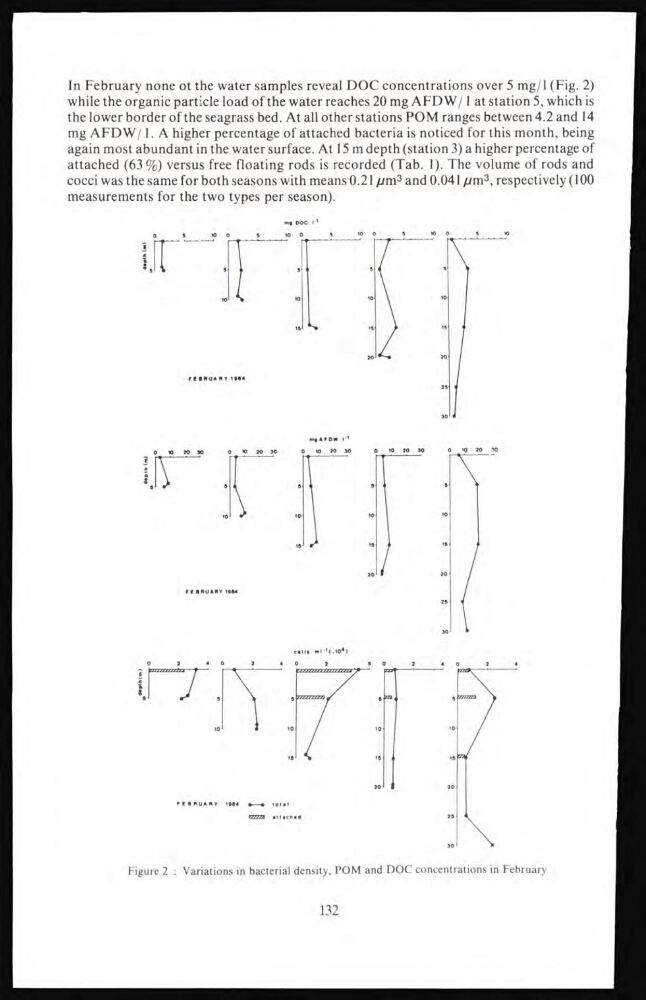
In February none ot the water samples reveal DOC concentrations over 5 mg/l (Fig. 2)
while the organic particle load of the water reaches 20 mg AFD W/1 at station 5, which is
the lower border of the seagrass bed. At all other stations POM ranges between 4.2 and 14
mg AFDW/1. A higher percentage of attached bacteria is noticed for this month, being
again most abundant in the water surface. At 15 m depth (station 3) a higher percentage of
attached (63 %) versus free floating rods is recorded (Tab. 1). The volume of rods and
cocci was the same for both seasons with means 0.21 µm 3 and 0.041 µm 3 , respectively ( 100
measurements for the two types per season).
FEBRUARY
1984
total
Figure 2 : Variations in bacterial density, POM and DOC concentrations in February
132
while the organic particle load of the water reaches 20 mg AFD W/1 at station 5, which is
the lower border of the seagrass bed. At all other stations POM ranges between 4.2 and 14
mg AFDW/1. A higher percentage of attached bacteria is noticed for this month, being
again most abundant in the water surface. At 15 m depth (station 3) a higher percentage of
attached (63 %) versus free floating rods is recorded (Tab. 1). The volume of rods and
cocci was the same for both seasons with means 0.21 µm 3 and 0.041 µm 3 , respectively ( 100
measurements for the two types per season).
FEBRUARY
1984
total
Figure 2 : Variations in bacterial density, POM and DOC concentrations in February
132