

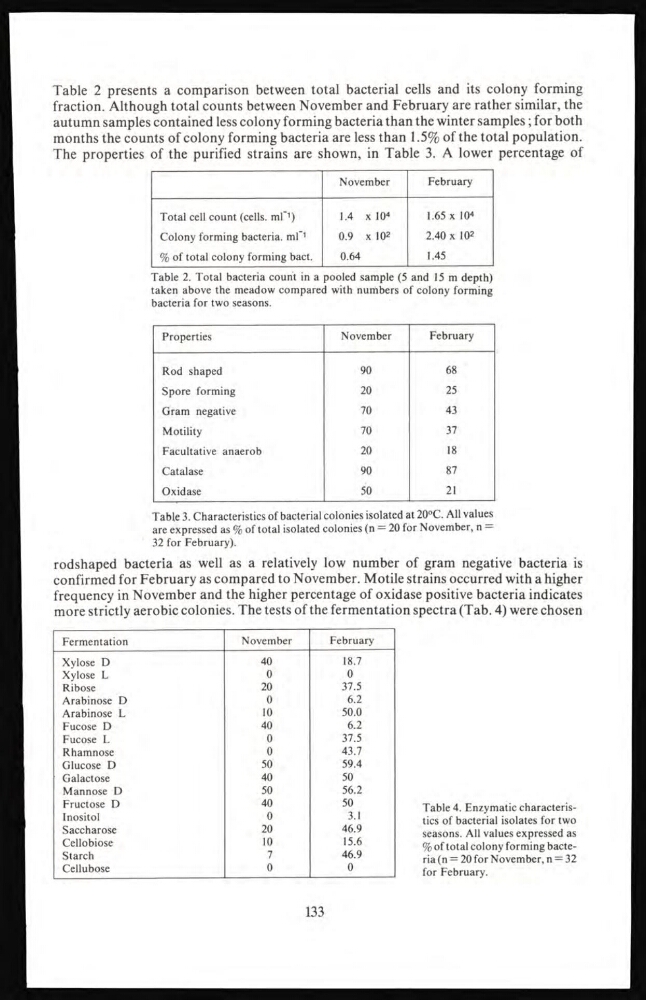
Table 2 presents a comparison between total bacterial cells and its colony forming
fraction. Although total counts between November and February are rather similar, the
autumn samples contained less colony forming bacteria than the winter samples ; for both
months the counts of colony forming bacteria are less than 1.5% of the total population.
The properties of the purified strains are shown, in Table 3. A lower percentage of
November
February
Total cell count (cells. ml 1 )
Colony forming bacteria. ml -1
% of total colony forming bact.
1.4 x 10 4
0.9 x 10 2
0.64
1.65 x 10 4
2.40 x 10 2
1.45
Table 2. Total bacteria count in a pooled sample (5 and 15 m depth)
taken above the meadow compared with numbers of colony forming
bacteria for two seasons.
Properties
November
February
Rod shaped
90
68
Spore forming
20
25
Gram negative
70
43
Motility
70
37
Facultative anaerob
20
18
Catalase
90
87
Oxidase
50
21
Table 3. Characteristics of bacterial colonies isolated at 20°C. All values
are expressed as % of total isolated colonies (n = 20 for November, n =
32 for February).
rodshaped bacteria as well as a relatively low number of gram negative bacteria is
confirmed for February as compared to November. Motile strains occurred with a higher
frequency in November and the higher percentage of oxidase positive bacteria indicates
more strictly aerobic colonies. The tests of the fermentation spectra (Tab. 4) were chosen
Table 4. Enzymatic characteristics of bacterial isolates for two
seasons. All values expressed as
% of total colony forming bacteria (n = 20 for November, n = 32
for February.
Fermentation
November
February
Xylose D
40
18.7
Xylose L
0
0
Ribose
20
37.5
Arabinose D
0
6.2
Arabinose L
10
50.0
Fucose D
40
6.2
Fucose L
0
37.5
Rhamnose
0
43.7
Glucose D
50
59.4
Galactose
40
50
Mannose D
50
56.2
Fructose D
40
50
Inositol
0
3.1
Saccharose
20
46.9
Cellobiose
10
15.6
Starch
7
46.9
Cellubose
0
0
133
fraction. Although total counts between November and February are rather similar, the
autumn samples contained less colony forming bacteria than the winter samples ; for both
months the counts of colony forming bacteria are less than 1.5% of the total population.
The properties of the purified strains are shown, in Table 3. A lower percentage of
November
February
Total cell count (cells. ml 1 )
Colony forming bacteria. ml -1
% of total colony forming bact.
1.4 x 10 4
0.9 x 10 2
0.64
1.65 x 10 4
2.40 x 10 2
1.45
Table 2. Total bacteria count in a pooled sample (5 and 15 m depth)
taken above the meadow compared with numbers of colony forming
bacteria for two seasons.
Properties
November
February
Rod shaped
90
68
Spore forming
20
25
Gram negative
70
43
Motility
70
37
Facultative anaerob
20
18
Catalase
90
87
Oxidase
50
21
Table 3. Characteristics of bacterial colonies isolated at 20°C. All values
are expressed as % of total isolated colonies (n = 20 for November, n =
32 for February).
rodshaped bacteria as well as a relatively low number of gram negative bacteria is
confirmed for February as compared to November. Motile strains occurred with a higher
frequency in November and the higher percentage of oxidase positive bacteria indicates
more strictly aerobic colonies. The tests of the fermentation spectra (Tab. 4) were chosen
Table 4. Enzymatic characteristics of bacterial isolates for two
seasons. All values expressed as
% of total colony forming bacteria (n = 20 for November, n = 32
for February.
Fermentation
November
February
Xylose D
40
18.7
Xylose L
0
0
Ribose
20
37.5
Arabinose D
0
6.2
Arabinose L
10
50.0
Fucose D
40
6.2
Fucose L
0
37.5
Rhamnose
0
43.7
Glucose D
50
59.4
Galactose
40
50
Mannose D
50
56.2
Fructose D
40
50
Inositol
0
3.1
Saccharose
20
46.9
Cellobiose
10
15.6
Starch
7
46.9
Cellubose
0
0
133