

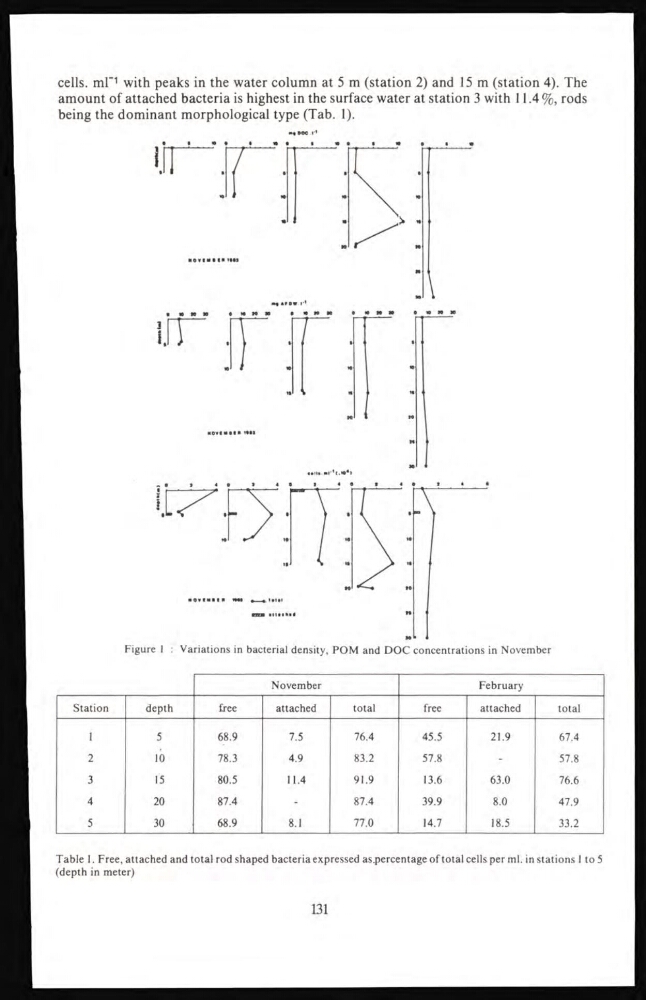
cells. ml*
1 with peaks in the water column at 5 m (station 2) and 15 m (station 4). The
amount of attached bacteria is highest in the surface water at station 3 with 11.4%, rods
being the dominant morphological type (Tab. 1).
»« OOC .!•«
••tu «r'(.*o 4 i
Figure 1 : Variations in bacterial density, POM and DOC concentrations in November
November
February
Station
depth
free
attached
total
free
attached
total
1
5
68.9
7.5
76.4
45.5
21.9
67.4
2
10
78.3
4.9
83.2
57.8
-
57.8
3
15
80.5
11.4
91.9
13.6
63.0
76.6
4
20
87.4
-
87.4
39.9
8.0
47.9
5
30
68.9
8.1
77.0
14.7
18.5
33.2
Table 1. Free, attached and total rod shaped bacteria expressed as percentage of total cells per ml. in stations 1 to 5
(depth in meter)
131
1 with peaks in the water column at 5 m (station 2) and 15 m (station 4). The
amount of attached bacteria is highest in the surface water at station 3 with 11.4%, rods
being the dominant morphological type (Tab. 1).
»« OOC .!•«
••tu «r'(.*o 4 i
Figure 1 : Variations in bacterial density, POM and DOC concentrations in November
November
February
Station
depth
free
attached
total
free
attached
total
1
5
68.9
7.5
76.4
45.5
21.9
67.4
2
10
78.3
4.9
83.2
57.8
-
57.8
3
15
80.5
11.4
91.9
13.6
63.0
76.6
4
20
87.4
-
87.4
39.9
8.0
47.9
5
30
68.9
8.1
77.0
14.7
18.5
33.2
Table 1. Free, attached and total rod shaped bacteria expressed as percentage of total cells per ml. in stations 1 to 5
(depth in meter)
131