

Marine lipids
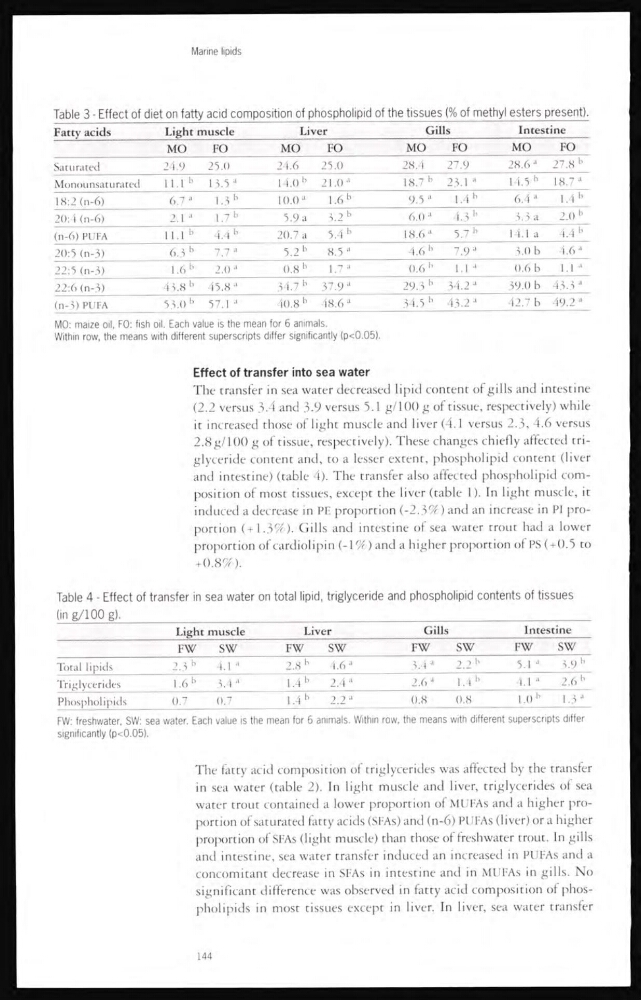
Table 3 - Effect of diet on fatty acid composition of phospholipid of the tissues (% of methyl esters present).
Fatty acids
Light muscle
Liver
Gills
Intestine
MO
FO
MO
FO
MO
FO
MO
FO
Saturated
24.9
25.0
24,6
25.0
28.4
27.9
28.6 a
27.8 b
Monounsaturated
11.1 b
13.5 a
14.0 b 21.0 a
18.7 b
23.1 a
14.5 b
18.7 a
18:2 (n-6)
6.7 a
1.3 b
10.0 a
1.6 b
0.5 a
1.4 b
6.4 a
1.4 b
20:4 (n-6)
2.1 a
1.7 b
5.0 a
3.2 b
6.0 a
4.3 b
3.3 a
2.0 b
(n-6) PUFA
11.1 b
4.4 b
20.7 a
5.4 b
18.6 a
5.7 b
14.1 a
4.4 b
20:5 (n-3)
6.3 b
7.7 a
5.2 b
8.5 a
4.6 b
7.9 a
3.0 b
4.6 a
22:5 (n-3)
1.6 b
2.0 a
0.8 b
1.7 a
0.6 b
1.1 a
0.6 b
1.1 a
22:0 (n-3)
43.8 b 45.8 a
34.7 b 37.9 a
29.3 b 34.2 a
39.0 b 43.3 a
(n-3) PUFA
53.0 b 57.1 a
40.8 b 48.6 a
34.5 b 43.2 a
42.7 b 49.2 a
MO: maize oil, FO: fish oil. Each value is the mean for 6 animals.
Within row, the means with different superscripts differ significantly (p<0.05).
Effect of transfer into sea water
The transfer in sea water decreased lipid content of gills and intestine
(2.2 versus 3.4 and 3.9 versus 5.1 g/100 g of tissue, respectively) while
it increased those of light muscle and liver (4.1 versus 2.3, 4.6 versus
2.8g/100 g of tissue, respectively). These changes chiefly affected triglyceride content and, to a lesser extent, phospholipid content (liver
and intestine) (table 4). The transfer also affected phospholipid composition of most tissues, except the liver (table 1 ). In light muscle, it
induced a decrease in PE proportion (-2.3%) and an increase in PI proportion (+1.3%). Gills and intestine of sea water trout had a lower
proportion of cardiolipin (-1%) and a higher proportion of PS ( + 0.5 to
+ 0.8%).
Table 4 - Effect of transfer in sea water on total lipid, triglyceride and phospholipid contents of tissues
(in g/100 g).
Light muscle
Liver
Gills
Intestine
FW
SW
FW
SW
FW
sw
FW
sw
Total lipids
2.3 b
4.1 a
2.8 b
4.6 a
3.4 a
2.2 b
5.1 a
3.9 b
Triglycerides
1.6 b
3.4 a
1.4 b
2.4 a
2.6 a
1.4 b
4.1 a
2.6 b
Phospholipids
0.7
0.7
1.4 b
2.2 a
0.8
0.8
1.0 b
1.3 a
FW: freshwater, SW: sea water. Each value is the mean for 6 animals. Within row, the means with different superscripts differ
significantly (p<0.05).
The fatty acid composition of triglycerides was affected by the transfer
in sea water (table 2). In light muscle and liver, triglycerides of sea
water trout contained a lower proportion of MUFAs and a higher proportion of saturated fatty acids (SFAs) and (n-6) PUFAs (liver) or a higher
proportion of SFAs (light muscle) than those of freshwater trout. In gills
and intestine, sea water transfer induced an increased in PUFAs and a
concomitant decrease in SFAs in mtestine ancl in MUFAs in gills. No
signif icant difference was observed in fatty acicl composition of phospholipids in most tissues except in liver. In liver, sea water transfer
144
Table 3 - Effect of diet on fatty acid composition of phospholipid of the tissues (% of methyl esters present).
Fatty acids
Light muscle
Liver
Gills
Intestine
MO
FO
MO
FO
MO
FO
MO
FO
Saturated
24.9
25.0
24,6
25.0
28.4
27.9
28.6 a
27.8 b
Monounsaturated
11.1 b
13.5 a
14.0 b 21.0 a
18.7 b
23.1 a
14.5 b
18.7 a
18:2 (n-6)
6.7 a
1.3 b
10.0 a
1.6 b
0.5 a
1.4 b
6.4 a
1.4 b
20:4 (n-6)
2.1 a
1.7 b
5.0 a
3.2 b
6.0 a
4.3 b
3.3 a
2.0 b
(n-6) PUFA
11.1 b
4.4 b
20.7 a
5.4 b
18.6 a
5.7 b
14.1 a
4.4 b
20:5 (n-3)
6.3 b
7.7 a
5.2 b
8.5 a
4.6 b
7.9 a
3.0 b
4.6 a
22:5 (n-3)
1.6 b
2.0 a
0.8 b
1.7 a
0.6 b
1.1 a
0.6 b
1.1 a
22:0 (n-3)
43.8 b 45.8 a
34.7 b 37.9 a
29.3 b 34.2 a
39.0 b 43.3 a
(n-3) PUFA
53.0 b 57.1 a
40.8 b 48.6 a
34.5 b 43.2 a
42.7 b 49.2 a
MO: maize oil, FO: fish oil. Each value is the mean for 6 animals.
Within row, the means with different superscripts differ significantly (p<0.05).
Effect of transfer into sea water
The transfer in sea water decreased lipid content of gills and intestine
(2.2 versus 3.4 and 3.9 versus 5.1 g/100 g of tissue, respectively) while
it increased those of light muscle and liver (4.1 versus 2.3, 4.6 versus
2.8g/100 g of tissue, respectively). These changes chiefly affected triglyceride content and, to a lesser extent, phospholipid content (liver
and intestine) (table 4). The transfer also affected phospholipid composition of most tissues, except the liver (table 1 ). In light muscle, it
induced a decrease in PE proportion (-2.3%) and an increase in PI proportion (+1.3%). Gills and intestine of sea water trout had a lower
proportion of cardiolipin (-1%) and a higher proportion of PS ( + 0.5 to
+ 0.8%).
Table 4 - Effect of transfer in sea water on total lipid, triglyceride and phospholipid contents of tissues
(in g/100 g).
Light muscle
Liver
Gills
Intestine
FW
SW
FW
SW
FW
sw
FW
sw
Total lipids
2.3 b
4.1 a
2.8 b
4.6 a
3.4 a
2.2 b
5.1 a
3.9 b
Triglycerides
1.6 b
3.4 a
1.4 b
2.4 a
2.6 a
1.4 b
4.1 a
2.6 b
Phospholipids
0.7
0.7
1.4 b
2.2 a
0.8
0.8
1.0 b
1.3 a
FW: freshwater, SW: sea water. Each value is the mean for 6 animals. Within row, the means with different superscripts differ
significantly (p<0.05).
The fatty acid composition of triglycerides was affected by the transfer
in sea water (table 2). In light muscle and liver, triglycerides of sea
water trout contained a lower proportion of MUFAs and a higher proportion of saturated fatty acids (SFAs) and (n-6) PUFAs (liver) or a higher
proportion of SFAs (light muscle) than those of freshwater trout. In gills
and intestine, sea water transfer induced an increased in PUFAs and a
concomitant decrease in SFAs in mtestine ancl in MUFAs in gills. No
signif icant difference was observed in fatty acicl composition of phospholipids in most tissues except in liver. In liver, sea water transfer
144