

Marine lipids
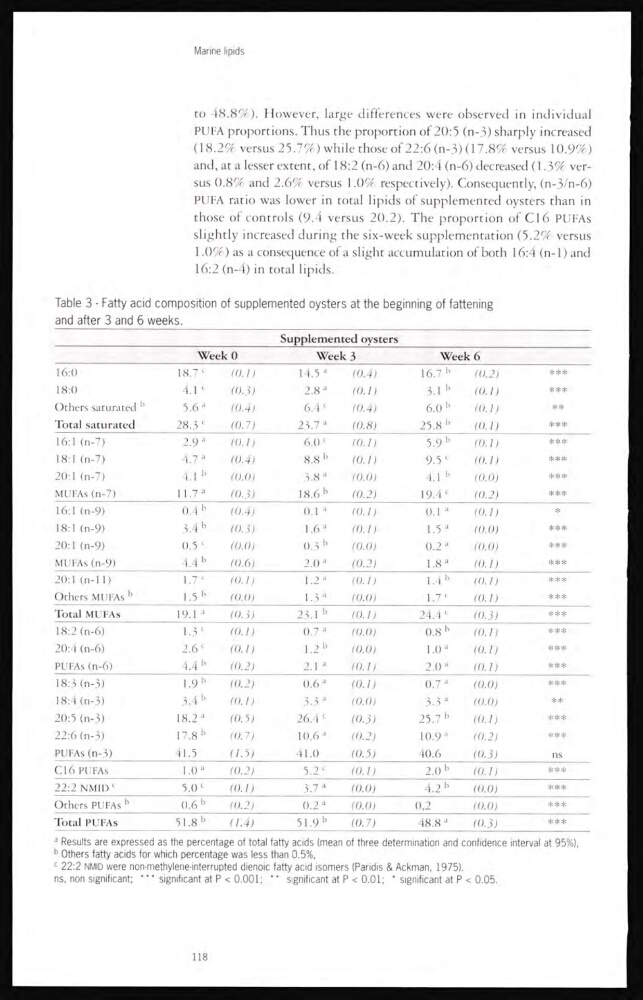
to 48.8%). However, large differences were observed in individual
PUFA proportions. Thus the proportion of 20:5 (n-3) sharply increased
( 18.2% versus 25.7% ) while those of 22:6 (n-3) ( 17.8% versus 10.9% )
and, at a lesser extent, of 18:2 (n-6) and 20:4 (n-6) decreased (1.3% versus 0.8% and 2.6% versus 1.0% respectively). Consequently, (n-3/n-6)
PUFA ratio was lower in total lipids of supplemented oysters than in
those of controls (9.4 versus 20.2). The proportion of C16 PUFAs
slightly increased during the six-week supplementation (5.2% versus
1.0%) as a consequence of a slight accumulation of both 16:4 (n-1) and
16:2 (n-4) in total lipids.
Table 3 - Fatty acid composition of supplemented oysters at the beginning of fattening
and after 3 and 6 weeks.
Supplemented oysters
Week 0
Week 3
Week 6
16:0
18.7 c
(0.1)
14.5 a
(0.4)
16.7 b
(0.2)
***
18:0
4.l c
(0.3)
2.8 a
(0.1)
3.1 b
(0.1)
***
Others saturated b
5.6 a
(0.4)
6.4 c
(0.4)
6.0 b
(0.1)
**
Total saturated
28.3 c
(0.7)
23.7 a
(0.8)
25.8 b
(0.1)
***
16:1(n-7)
2.9 a
(0.1)
6.0 c
(0.1)
5.9 b
(0.1)
***
18:1 ( n-7 )
4.7 a
(0.4)
8.8 b
(0.1)
9.5 c
(0.1)
***
20:1 (n-7)
4.1 b
(0.0)
3.8 a
(0.0)
4.1 b
(0.0)
***
MUFAs (n-7)
11.7 a
(0.3)
18.6 b
(0.2)
19.4 c
(0.2)
***
16:1 (n-9)
0.4 b
(0.4)
0.1 “
(0.1)
0.1 “
(0.1)
*
18:1 (n-9)
3.4 b
(0.3)
1.6 a
(0.1)
1.5 a
(0.0)
***
20:1 (n-9)
0.5 c
(0.0)
0.3 b
(0.0)
0.2 a
(0.0)
***
MUFAs (n-9)
4.4 b
(0.6)
2.0 “
(0.2)
1.8 a
(0.1)
***
20:1 (n-11)
1.7 c
(0.1)
1.2 a
(0.1)
1.4 b
(0.1)
***
Others MUFAs b
1.5 b
(0.0)
1.3 a
(0.0)
1.7 c
(0.1)
***
Total MUFAs
19.1 a
(0.3)
2 5.1 b
(0.1)
24.4 c
(0.3)
***
18:2(n-6)
1.3 c
(0.1)
0.7 “
(0.0)
0.8 b
(0.1)
***
20:4 (n-6)
2.6 c
(0.1)
1.2 b
(0.0)
1.0 a
(0.1)
***
PUFAs (n-6)
4.4 b
(0.2)
2.1 a
(0.1)
2.0 a
(0.1)
***
18:3 (n-3)
1.9 b
(0.2)
0.6 a
(0.1)
0.7 “
(0.0)
***
18:4 (n-3)
.3.4 b
(0.1)
3.3 a
(0.0)
3.3 “
(0.0)
**
20:5 (n-3)
18.2 a
(0.5)
26.4 c
(0.3)
25.7 b
(0.1)
***
22:6 (n-3)
17.8 b
(0.7)
10.6 a
(0.2)
10.9 a
(0.2)
***
PUFAs (n-3)
41.5
(6 5)
41.0
(0.5)
40.6
(0.3)
ns
C16 PUFAs
1.0 a
(0.2)
5.2 c
(0.1)
2.0 b
(0.1)
***
22:2 NMID c
5.0 c
(0.1)
3.7 a
(0.0)
4.2 b
(.0.0)
***
Others PUFAs b
0.6 b
(0.2)
0.2 a
(0.0)
0.2
(0.0)
***
Total PUFAs
51.8 b
(1.4)
51.9 b
(0.7)
48.8 “
(0.3)
***
a Results are expressed as the percentage of total fatty acids (mean of three determination and confidence interval at 95%),
b Others fatty acids for which percentage was less than 0.5%,
c 22:2 NMID were non-methylene-interrupted dienoic fatty acid isomers (Paridis & Ackman, 1975).
ns, non significant;
significant at P < 0.001; ** significant at P < 0.01; * significant at P < 0.05.
118
to 48.8%). However, large differences were observed in individual
PUFA proportions. Thus the proportion of 20:5 (n-3) sharply increased
( 18.2% versus 25.7% ) while those of 22:6 (n-3) ( 17.8% versus 10.9% )
and, at a lesser extent, of 18:2 (n-6) and 20:4 (n-6) decreased (1.3% versus 0.8% and 2.6% versus 1.0% respectively). Consequently, (n-3/n-6)
PUFA ratio was lower in total lipids of supplemented oysters than in
those of controls (9.4 versus 20.2). The proportion of C16 PUFAs
slightly increased during the six-week supplementation (5.2% versus
1.0%) as a consequence of a slight accumulation of both 16:4 (n-1) and
16:2 (n-4) in total lipids.
Table 3 - Fatty acid composition of supplemented oysters at the beginning of fattening
and after 3 and 6 weeks.
Supplemented oysters
Week 0
Week 3
Week 6
16:0
18.7 c
(0.1)
14.5 a
(0.4)
16.7 b
(0.2)
***
18:0
4.l c
(0.3)
2.8 a
(0.1)
3.1 b
(0.1)
***
Others saturated b
5.6 a
(0.4)
6.4 c
(0.4)
6.0 b
(0.1)
**
Total saturated
28.3 c
(0.7)
23.7 a
(0.8)
25.8 b
(0.1)
***
16:1(n-7)
2.9 a
(0.1)
6.0 c
(0.1)
5.9 b
(0.1)
***
18:1 ( n-7 )
4.7 a
(0.4)
8.8 b
(0.1)
9.5 c
(0.1)
***
20:1 (n-7)
4.1 b
(0.0)
3.8 a
(0.0)
4.1 b
(0.0)
***
MUFAs (n-7)
11.7 a
(0.3)
18.6 b
(0.2)
19.4 c
(0.2)
***
16:1 (n-9)
0.4 b
(0.4)
0.1 “
(0.1)
0.1 “
(0.1)
*
18:1 (n-9)
3.4 b
(0.3)
1.6 a
(0.1)
1.5 a
(0.0)
***
20:1 (n-9)
0.5 c
(0.0)
0.3 b
(0.0)
0.2 a
(0.0)
***
MUFAs (n-9)
4.4 b
(0.6)
2.0 “
(0.2)
1.8 a
(0.1)
***
20:1 (n-11)
1.7 c
(0.1)
1.2 a
(0.1)
1.4 b
(0.1)
***
Others MUFAs b
1.5 b
(0.0)
1.3 a
(0.0)
1.7 c
(0.1)
***
Total MUFAs
19.1 a
(0.3)
2 5.1 b
(0.1)
24.4 c
(0.3)
***
18:2(n-6)
1.3 c
(0.1)
0.7 “
(0.0)
0.8 b
(0.1)
***
20:4 (n-6)
2.6 c
(0.1)
1.2 b
(0.0)
1.0 a
(0.1)
***
PUFAs (n-6)
4.4 b
(0.2)
2.1 a
(0.1)
2.0 a
(0.1)
***
18:3 (n-3)
1.9 b
(0.2)
0.6 a
(0.1)
0.7 “
(0.0)
***
18:4 (n-3)
.3.4 b
(0.1)
3.3 a
(0.0)
3.3 “
(0.0)
**
20:5 (n-3)
18.2 a
(0.5)
26.4 c
(0.3)
25.7 b
(0.1)
***
22:6 (n-3)
17.8 b
(0.7)
10.6 a
(0.2)
10.9 a
(0.2)
***
PUFAs (n-3)
41.5
(6 5)
41.0
(0.5)
40.6
(0.3)
ns
C16 PUFAs
1.0 a
(0.2)
5.2 c
(0.1)
2.0 b
(0.1)
***
22:2 NMID c
5.0 c
(0.1)
3.7 a
(0.0)
4.2 b
(.0.0)
***
Others PUFAs b
0.6 b
(0.2)
0.2 a
(0.0)
0.2
(0.0)
***
Total PUFAs
51.8 b
(1.4)
51.9 b
(0.7)
48.8 “
(0.3)
***
a Results are expressed as the percentage of total fatty acids (mean of three determination and confidence interval at 95%),
b Others fatty acids for which percentage was less than 0.5%,
c 22:2 NMID were non-methylene-interrupted dienoic fatty acid isomers (Paridis & Ackman, 1975).
ns, non significant;
significant at P < 0.001; ** significant at P < 0.01; * significant at P < 0.05.
118