

Function and metabolism
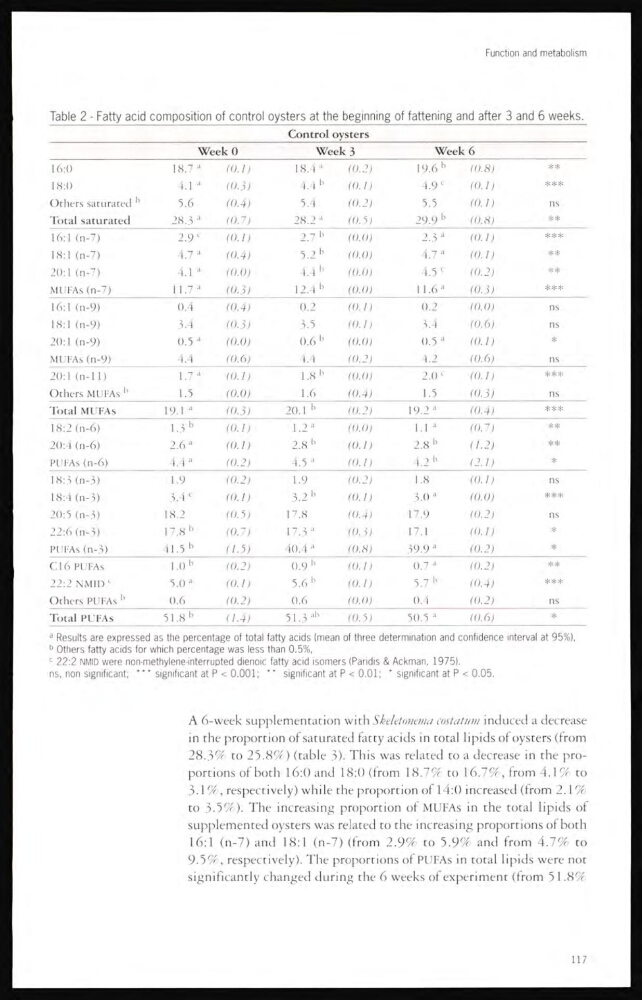
Table 2 - Fatty acid composition of control oysters at the beginning of fattening and after 3 and 6 weeks.
Control oysters
Week 0
Week 3
Week 6
16:0
18.7 a
(0.1)
18.4 a
(0.2)
19.6 b
(0.8)
**
18:0
4.1 a
(0.3)
4.4 b
(0.1)
4.9 c
(0.1)
***
Others saturated b
5,6
(0.4)
5.4
(0.2)
5.5
(0.1)
ns
Total saturated
28.3
(0.7)
28.2 a
(0.5)
29.9 b
(0.3)
**
16:1 (n-7)
2.9 c
(0.1)
2.7 b
(0.0)
2.3 a
(0.1)
***
18:1 (n-7)
4.7 a
(0.4)
5.2 b
(0.0)
4.7 a
(0.1)
**
20:1 (n-7)
1.1
(0.0)
4.4 b
(0.0)
4.5 c
(0.2)
**
MUFAs (n-7)
11.7 a
(0.3)
12.4 b
(0.0)
11.6 a
(0.3)
***
16:1 (n-9)
0.4
(O.O)
0.2
(O.l)
0.2
(0.0)
ns
18:1 (n-9)
3.4
(0.3)
3.5
(0.1)
3.4
(0.6)
ns
20:1 (n-9)
0.5
(0.0)
0.6 b
(0.0)
0.5 a
(0.1)
*
MUFAs (n-9)
4.4
(0.6)
4.4
(0.2)
4.2
(0.6)
ns
20:1 (n-11)
1.7
(0.1)
1.8 b
(O.O)
2.0 >
(0.1)
***
Others MUFAs b
1.5
(O.O)
1.6
(0.0)
1.5
(0.3)
ns
Total MUFAs
19.1 a
(0.3)
20.1 b
(0.2)
19.2 a
(0.4)
***
18:2 (n-6)
1.3 b
(0.1)
1.2 a
(0.0)
1.1 a
(0.7)
**
20:4 (n-6)
2.6 a
(0.1)
2.8 b
(0.1)
2,8 b
(1.2)
**
PUFAs (n-6)
4.4 a
(0.2)
4.5 a
(0.1)
4.2 b
(2.1)
*
18:3 (n-3)
1.9
(0.2)
1.9
(0.2)
1 .8
(0.1)
ns
18:4 (n-3)
3.4 c
(0.1)
3.2 b
(0.1)
3.0"
(0.0)
***
20:5 (n-3)
18.2
(0.3)
17.8
(0.4)
17.9
(0.2)
ns
22:6 (n-3)
17.8 b
(0.7)
17.3 a
(0.3)
17.1
(O.l)
*
PUFAs (n-3)
41.5 b
(1.5)
40.4 a
(0.8)
39.9 a
(0.2)
*
C16 PUFAs
1.0 b
(0.2)
0.9 b
(0.1)
0.7 "
(0.2)
**
22:2 NMID c
5.0 a
(0.1)
5.6 b
(0.1)
5.7 b
(0.4)
***
Others PUFAs b
0.6
(0.2)
0.6
(0.0)
0.4
(0.2)
ns
Total PUFAs
51.8 b
(1.0)
51.3 ab
(0. 5)
50.5 a
(0.6)
*
a Results are expressed as the percentage of total fatty acids (mean of three determination and confidence interval at 95%),
b Others fatty acids for which percentage was less than 0.5%,
c 22:2 NMID were non-methylene-interrupted dienoic fatty acid isomers (Paridis & Ackman, 1975).
ns, non significant; *** significant at P < 0.001; ** significant at P < 0.01; * significant at P < 0.05.
A 6-week supplementation with Skeletonema costatum induced a decrease
in the proportion of saturated fatty acids in total lipids of oysters (from
28.3% to 25.8%) (table 3). This was related to a decrease in the proportions of both 16:0 and 18:0 (from 18.7% to 16.7%, from 4.1 % to
3.1 % , respectively) while the proportion of 14:0 increased (from 2.1%
to 3.5%). The increasing proportion of MUFAs in the total lipids of
supplemented oysters was related to the increasing proportions of both
16:1 (n-7) and 18:1 (n-7) (from 2.9% to 5.9% and from 4.7% to
9.5% , respectively). The proportions of PUFAs in total lipids were not
significantly changed during the 6 weeks of experiment (from 51.8%
117
Table 2 - Fatty acid composition of control oysters at the beginning of fattening and after 3 and 6 weeks.
Control oysters
Week 0
Week 3
Week 6
16:0
18.7 a
(0.1)
18.4 a
(0.2)
19.6 b
(0.8)
**
18:0
4.1 a
(0.3)
4.4 b
(0.1)
4.9 c
(0.1)
***
Others saturated b
5,6
(0.4)
5.4
(0.2)
5.5
(0.1)
ns
Total saturated
28.3
(0.7)
28.2 a
(0.5)
29.9 b
(0.3)
**
16:1 (n-7)
2.9 c
(0.1)
2.7 b
(0.0)
2.3 a
(0.1)
***
18:1 (n-7)
4.7 a
(0.4)
5.2 b
(0.0)
4.7 a
(0.1)
**
20:1 (n-7)
1.1
(0.0)
4.4 b
(0.0)
4.5 c
(0.2)
**
MUFAs (n-7)
11.7 a
(0.3)
12.4 b
(0.0)
11.6 a
(0.3)
***
16:1 (n-9)
0.4
(O.O)
0.2
(O.l)
0.2
(0.0)
ns
18:1 (n-9)
3.4
(0.3)
3.5
(0.1)
3.4
(0.6)
ns
20:1 (n-9)
0.5
(0.0)
0.6 b
(0.0)
0.5 a
(0.1)
*
MUFAs (n-9)
4.4
(0.6)
4.4
(0.2)
4.2
(0.6)
ns
20:1 (n-11)
1.7
(0.1)
1.8 b
(O.O)
2.0 >
(0.1)
***
Others MUFAs b
1.5
(O.O)
1.6
(0.0)
1.5
(0.3)
ns
Total MUFAs
19.1 a
(0.3)
20.1 b
(0.2)
19.2 a
(0.4)
***
18:2 (n-6)
1.3 b
(0.1)
1.2 a
(0.0)
1.1 a
(0.7)
**
20:4 (n-6)
2.6 a
(0.1)
2.8 b
(0.1)
2,8 b
(1.2)
**
PUFAs (n-6)
4.4 a
(0.2)
4.5 a
(0.1)
4.2 b
(2.1)
*
18:3 (n-3)
1.9
(0.2)
1.9
(0.2)
1 .8
(0.1)
ns
18:4 (n-3)
3.4 c
(0.1)
3.2 b
(0.1)
3.0"
(0.0)
***
20:5 (n-3)
18.2
(0.3)
17.8
(0.4)
17.9
(0.2)
ns
22:6 (n-3)
17.8 b
(0.7)
17.3 a
(0.3)
17.1
(O.l)
*
PUFAs (n-3)
41.5 b
(1.5)
40.4 a
(0.8)
39.9 a
(0.2)
*
C16 PUFAs
1.0 b
(0.2)
0.9 b
(0.1)
0.7 "
(0.2)
**
22:2 NMID c
5.0 a
(0.1)
5.6 b
(0.1)
5.7 b
(0.4)
***
Others PUFAs b
0.6
(0.2)
0.6
(0.0)
0.4
(0.2)
ns
Total PUFAs
51.8 b
(1.0)
51.3 ab
(0. 5)
50.5 a
(0.6)
*
a Results are expressed as the percentage of total fatty acids (mean of three determination and confidence interval at 95%),
b Others fatty acids for which percentage was less than 0.5%,
c 22:2 NMID were non-methylene-interrupted dienoic fatty acid isomers (Paridis & Ackman, 1975).
ns, non significant; *** significant at P < 0.001; ** significant at P < 0.01; * significant at P < 0.05.
A 6-week supplementation with Skeletonema costatum induced a decrease
in the proportion of saturated fatty acids in total lipids of oysters (from
28.3% to 25.8%) (table 3). This was related to a decrease in the proportions of both 16:0 and 18:0 (from 18.7% to 16.7%, from 4.1 % to
3.1 % , respectively) while the proportion of 14:0 increased (from 2.1%
to 3.5%). The increasing proportion of MUFAs in the total lipids of
supplemented oysters was related to the increasing proportions of both
16:1 (n-7) and 18:1 (n-7) (from 2.9% to 5.9% and from 4.7% to
9.5% , respectively). The proportions of PUFAs in total lipids were not
significantly changed during the 6 weeks of experiment (from 51.8%
117