

422
M. V. L. BENNETT
-
I msec
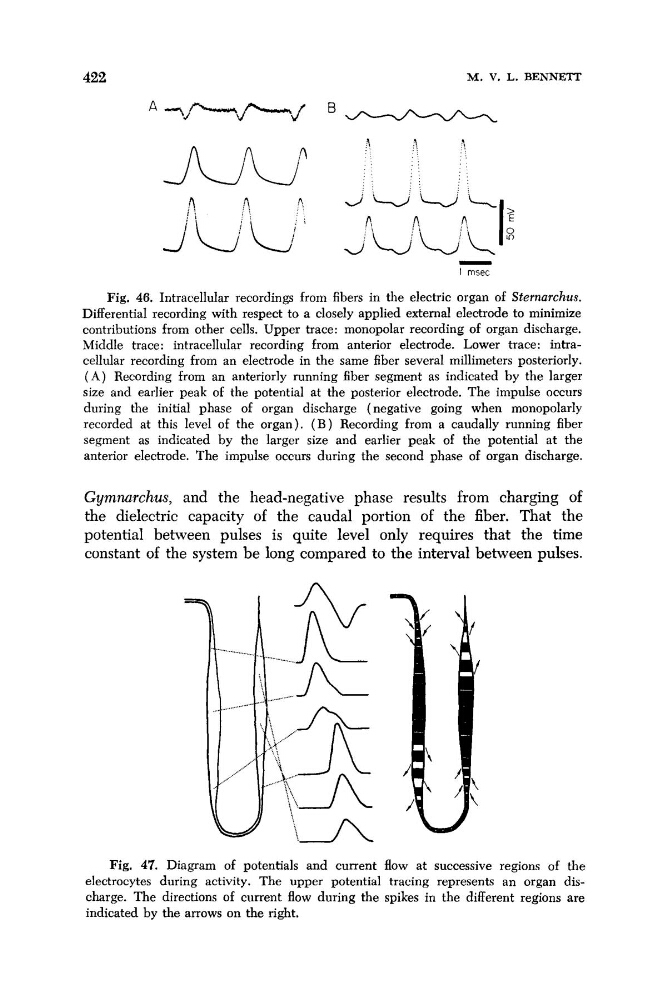
Fig. 46. Intracellular recordings from fibers in the electric organ of Sternarchus.
Differential recording with respect to a closely applied external electrode to minimize
contributions from other cells. Upper trace: monopolar recording of organ discharge.
Middle trace: intracellular recording from anterior electrode. Lower trace: intracellular recording from an electrode in the same fiber several millimeters posteriorly.
( A ) Recording from an anteriorly running fiber segment as indicated by the larger
size and earlier peak of the potential at the posterior electrode. The impulse occurs
during the initial phase of organ discharge (negative going when monopolarly
recorded at this level of the organ). ( B ) Recording from a caudally running fiber
segment as indicated by the larger size and earlier peak of the potential at the
anterior electrode. The impulse occurs during the second phase of organ discharge.
Gymnurchus, and the head-negative phase results from charging of
the dielectric capacity of the caudal portion of the fiber. That the
potential between pulses is quite level only requires that the time
constant of the system be long compared to the interval between pulses.
Fig. 47. Diagram of potentials and current flow at successive regions of the
electrocytes during activity. The upper potential tracing represents an organ discharge. The directions of current flow during the spikes in the different regions are
indicated by the arrows on the right.
M. V. L. BENNETT
-
I msec
Fig. 46. Intracellular recordings from fibers in the electric organ of Sternarchus.
Differential recording with respect to a closely applied external electrode to minimize
contributions from other cells. Upper trace: monopolar recording of organ discharge.
Middle trace: intracellular recording from anterior electrode. Lower trace: intracellular recording from an electrode in the same fiber several millimeters posteriorly.
( A ) Recording from an anteriorly running fiber segment as indicated by the larger
size and earlier peak of the potential at the posterior electrode. The impulse occurs
during the initial phase of organ discharge (negative going when monopolarly
recorded at this level of the organ). ( B ) Recording from a caudally running fiber
segment as indicated by the larger size and earlier peak of the potential at the
anterior electrode. The impulse occurs during the second phase of organ discharge.
Gymnurchus, and the head-negative phase results from charging of
the dielectric capacity of the caudal portion of the fiber. That the
potential between pulses is quite level only requires that the time
constant of the system be long compared to the interval between pulses.
Fig. 47. Diagram of potentials and current flow at successive regions of the
electrocytes during activity. The upper potential tracing represents an organ discharge. The directions of current flow during the spikes in the different regions are
indicated by the arrows on the right.