

414
M. V. L. BENNETT
. . . . . . . . . . . . . . . . . . . . . . . . . . .
Peak of spike
.......
-5 ........................ I
.....
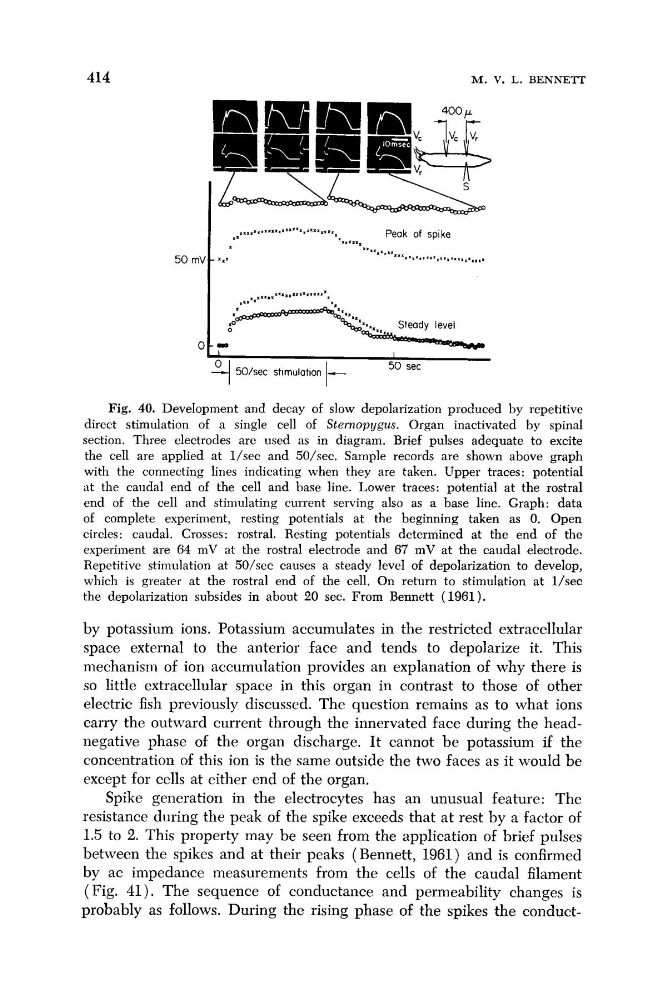
Fig. 40. Development and decay of slow depolarization produced by repetitive
direct stimulation of a single cell of Sternopygus. Organ inactivated by spinal
section. Three electrodes are used as in diagram. Brief pulses adequate to excite
the cell are applied at l/sec and 50/sec. Sample records are shown above graph
with the connecting lines indicating when they are taken. Upper traces: potential
at the caudal end of the cell and base line. Lower traces: potential at the rostral
end of the cell and stimulating current serving also as a base line. Graph: data
of complete experiment, resting potentials at the beginning taken as 0. Open
circles: caudal. Crosses: rostral. Resting potentials determined at the end of the
experiment are 64 mV at the rostral electrode and 67 mV at the caudal electrode.
Repetitive stimulation at 50/sec causes a steady level of depolarization to develop,
which is greater at the rostral end of the cell. On return to stimulation at l/sec
the depolarization subsides in about 20 sec. From Bennett ( 1961).
by potassium ions. Potassium accumulates in the restricted extracellular
space external to the anterior face and tends to depolarize it. This
mechanisni of ion accumulation provides an explanation of why there is
so little extracellular space in this organ in contrast to those of other
electric fish previously discussed. The question remains as to what ions
carry the outward current through the innervated face during the headnegative phase of the organ discharge. It cannot be potassium if the
concentration of this ion is the same outside the two faces as it would be
except for cells at either end of the organ.
Spike generation in the electrocytes has an unusual feature: The
resistance during the peak of the spike exceeds that at rest by a factor of
1.5 to 2. This property may be seen from the application of brief pulses
between the spikes and at their peaks (Bennett, 1961) and is confirmed
by ac impedance measurements from the cells of the caudal filament
(Fig. 41). The sequence of conductance and permeability changes is
probably as follows. During the rising phase of the spikes the conduct-
M. V. L. BENNETT
. . . . . . . . . . . . . . . . . . . . . . . . . . .
Peak of spike
.......
-5 ........................ I
.....
Fig. 40. Development and decay of slow depolarization produced by repetitive
direct stimulation of a single cell of Sternopygus. Organ inactivated by spinal
section. Three electrodes are used as in diagram. Brief pulses adequate to excite
the cell are applied at l/sec and 50/sec. Sample records are shown above graph
with the connecting lines indicating when they are taken. Upper traces: potential
at the caudal end of the cell and base line. Lower traces: potential at the rostral
end of the cell and stimulating current serving also as a base line. Graph: data
of complete experiment, resting potentials at the beginning taken as 0. Open
circles: caudal. Crosses: rostral. Resting potentials determined at the end of the
experiment are 64 mV at the rostral electrode and 67 mV at the caudal electrode.
Repetitive stimulation at 50/sec causes a steady level of depolarization to develop,
which is greater at the rostral end of the cell. On return to stimulation at l/sec
the depolarization subsides in about 20 sec. From Bennett ( 1961).
by potassium ions. Potassium accumulates in the restricted extracellular
space external to the anterior face and tends to depolarize it. This
mechanisni of ion accumulation provides an explanation of why there is
so little extracellular space in this organ in contrast to those of other
electric fish previously discussed. The question remains as to what ions
carry the outward current through the innervated face during the headnegative phase of the organ discharge. It cannot be potassium if the
concentration of this ion is the same outside the two faces as it would be
except for cells at either end of the organ.
Spike generation in the electrocytes has an unusual feature: The
resistance during the peak of the spike exceeds that at rest by a factor of
1.5 to 2. This property may be seen from the application of brief pulses
between the spikes and at their peaks (Bennett, 1961) and is confirmed
by ac impedance measurements from the cells of the caudal filament
(Fig. 41). The sequence of conductance and permeability changes is
probably as follows. During the rising phase of the spikes the conduct-