

10. ELECTRIC ORGANS
Peak
.
'
.
x
. . +J
Rqa
20 mV
377
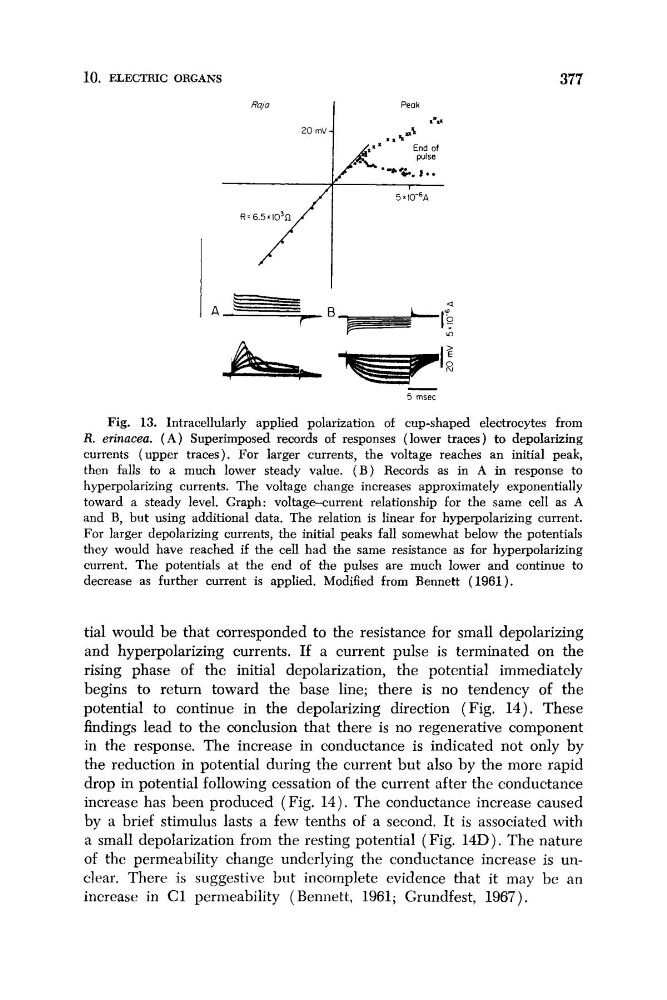
Fig. 13. Intracellularly applied polarization of cup-shaped electrocytes from
R. eriinacea. ( A ) Superimposed records of responses (lower traces) to depolarizing
currents (upper traces). For larger currents, the voltage reaches an initial peak,
then falls to a much lower steady value. ( B ) Records as in A in response to
hyperpolarizing currents. The voltage change increases approximately exponentially
toward a steady level. Graph: voltage-current relationship for the same cell as A
and B, but using additional data. The relation is linear for hyperpolarizing current.
For larger depolarizing currents, the initial peaks fall somewhat below the potentials
they would have reached if the cell had the same resistance as for hyperpolarizing
current. The potentials at the end of the pulses are much lower and continue to
decrease as further current is applied. Modified from Bennett (1961).
tial would be that corresponded to the resistance for small depolarizing
and hyperpolarizing currents. If a current pulse is terminated on the
rising phase of the initial depolarization, the potential immediately
begins to return toward the base line; there is no tendency of the
potential to continue in the depolarizing direction (Fig. 14). These
findings lead to the conclusion that there is no regenerative component
in the response. The increase in conductance is indicated not only by
the reduction in potential during the current but also by the more rapid
drop in potential following cessation of the current after the conductance
increase has been produced ( Fig. 14). The conductance increase caused
by a brief stimulus lasts a few tenths of a second. It is associated with
a small depolarization from the resting potential (Fig. 14D). The nature
of the permeability change underlying the conductance increase is unclear. There is suggestive but incomplete evidence that it may be an
increase in C1 permeability ( Bennett, 1961; Grundfest, 1967).
Peak
.
'
.
x
. . +J
Rqa
20 mV
377
Fig. 13. Intracellularly applied polarization of cup-shaped electrocytes from
R. eriinacea. ( A ) Superimposed records of responses (lower traces) to depolarizing
currents (upper traces). For larger currents, the voltage reaches an initial peak,
then falls to a much lower steady value. ( B ) Records as in A in response to
hyperpolarizing currents. The voltage change increases approximately exponentially
toward a steady level. Graph: voltage-current relationship for the same cell as A
and B, but using additional data. The relation is linear for hyperpolarizing current.
For larger depolarizing currents, the initial peaks fall somewhat below the potentials
they would have reached if the cell had the same resistance as for hyperpolarizing
current. The potentials at the end of the pulses are much lower and continue to
decrease as further current is applied. Modified from Bennett (1961).
tial would be that corresponded to the resistance for small depolarizing
and hyperpolarizing currents. If a current pulse is terminated on the
rising phase of the initial depolarization, the potential immediately
begins to return toward the base line; there is no tendency of the
potential to continue in the depolarizing direction (Fig. 14). These
findings lead to the conclusion that there is no regenerative component
in the response. The increase in conductance is indicated not only by
the reduction in potential during the current but also by the more rapid
drop in potential following cessation of the current after the conductance
increase has been produced ( Fig. 14). The conductance increase caused
by a brief stimulus lasts a few tenths of a second. It is associated with
a small depolarization from the resting potential (Fig. 14D). The nature
of the permeability change underlying the conductance increase is unclear. There is suggestive but incomplete evidence that it may be an
increase in C1 permeability ( Bennett, 1961; Grundfest, 1967).