

1. VISUAL PIGMENTS
17
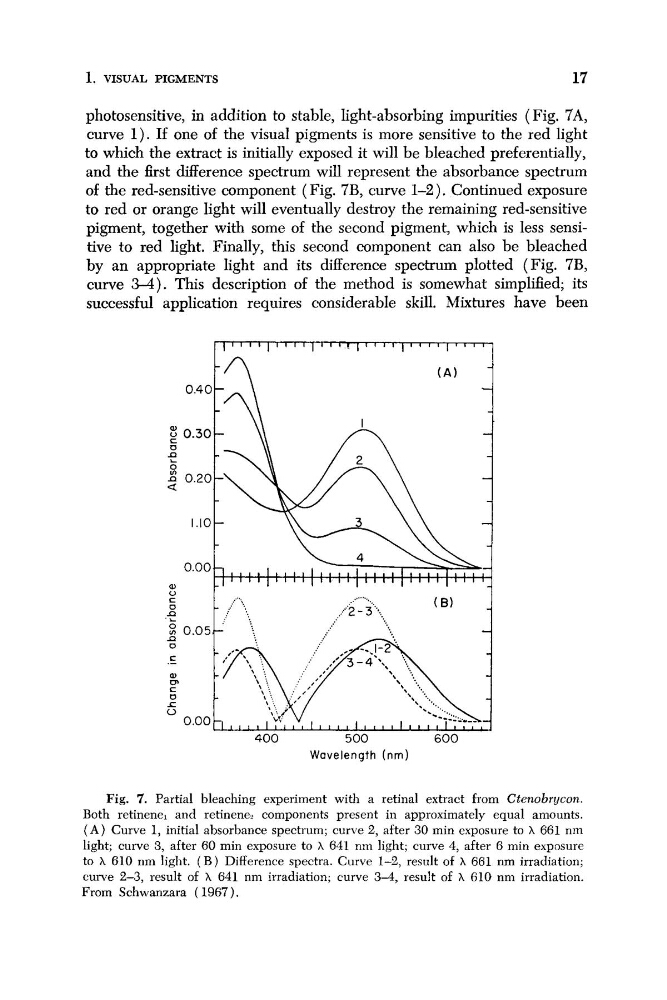
photosensitive, in addition to stable, light-absorbing impurities ( Fig. 7A,
curve 1 ) . If one of the visual pigments is more sensitive to the red light
to which the extract is initially exposed it will be bleached preferentially,
and the first difference spectrum will represent the absorbance spectrum
of the red-sensitive component ( Fig. 7B, curve 1-2). Continued exposure
to red or orange light will eventually destroy the remaining red-sensitive
pigment, together with some of the second pigment, which is less sensitive to red light. Finally, this second component can also be bleached
by an appropriate light and its difference spectrum plotted (Fig. 7B,
curve 3-4). This description of the method is somewhat simplified; its
successful application requires considerable skill. Mixtures have been
Wavelength (nm)
Fig. 7. Partial bleaching experiment with a retinal extract from Ctenobrycon.
Both retinenel and retinenet components present in approximately equal amounts.
( A ) Curve 1, initial absorbance spectrum; curve 2, after 30 min exposure to h 661 nm
light; curve 3, after 60 min exposure to h 641 nni light; curve 4, after 6 min exposure
to h 610 nm light. ( B ) Difference spectra. Curve 1-2, result of ? , 661 nm irradiation;
curve 2-3, result of h 641 nm irradiation; curve 34, result of h 610 nm irradiation.
From Schwanzara ( 1967 ).
17
photosensitive, in addition to stable, light-absorbing impurities ( Fig. 7A,
curve 1 ) . If one of the visual pigments is more sensitive to the red light
to which the extract is initially exposed it will be bleached preferentially,
and the first difference spectrum will represent the absorbance spectrum
of the red-sensitive component ( Fig. 7B, curve 1-2). Continued exposure
to red or orange light will eventually destroy the remaining red-sensitive
pigment, together with some of the second pigment, which is less sensitive to red light. Finally, this second component can also be bleached
by an appropriate light and its difference spectrum plotted (Fig. 7B,
curve 3-4). This description of the method is somewhat simplified; its
successful application requires considerable skill. Mixtures have been
Wavelength (nm)
Fig. 7. Partial bleaching experiment with a retinal extract from Ctenobrycon.
Both retinenel and retinenet components present in approximately equal amounts.
( A ) Curve 1, initial absorbance spectrum; curve 2, after 30 min exposure to h 661 nm
light; curve 3, after 60 min exposure to h 641 nni light; curve 4, after 6 min exposure
to h 610 nm light. ( B ) Difference spectra. Curve 1-2, result of ? , 661 nm irradiation;
curve 2-3, result of h 641 nm irradiation; curve 34, result of h 610 nm irradiation.
From Schwanzara ( 1967 ).