

F. W. MUNZ
500
600
Wavelength (nm)
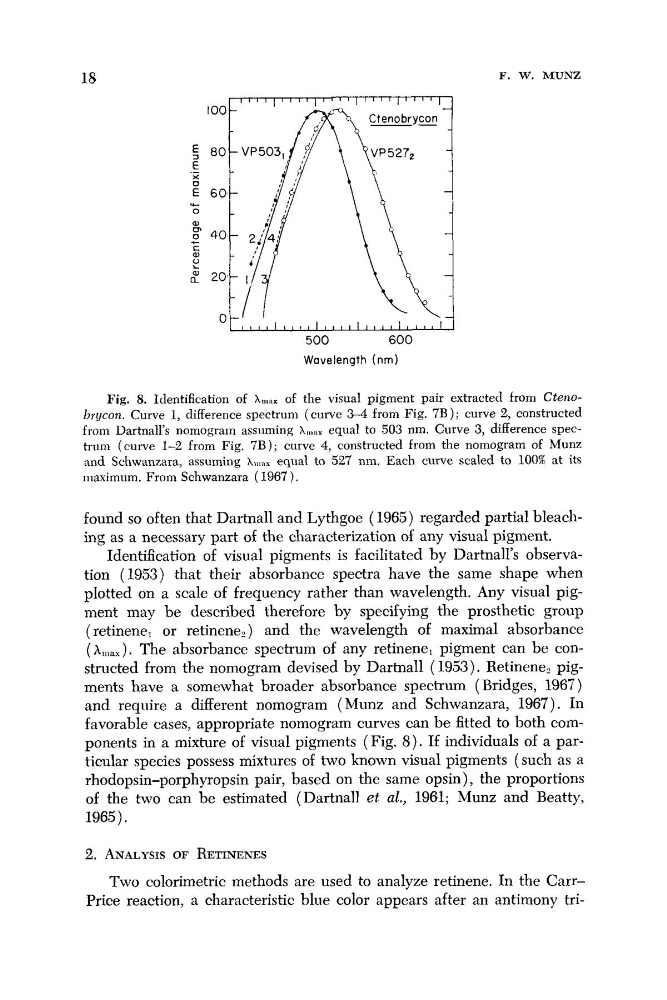
Fig. 8. Identification of A,,,,, of the visual pigment pair extracted from Ctenohrycon. Curve 1, difference spectrum (curve 3-4 from Fig. 7 B ) ; curve 2, constructed
from Dartnall's nomogram assuming A, , , : , , equal to 503 nm. Curve 3, difference spectrum (curve 1-2 from Fig. 7B); curve 4, constructed from the nomogram of Munz
and Schwanzara, assuming A,,,3x equal to 527 nm. Each curve scaled to 100% at its
maximum. From Schwanzara ( 1967 ).
found so often that Dartnall and Lythgoe (1965) regarded partial bleaching as a necessary part of the characterization of any visual pigment.
Identification of visual pigments is facilitated by Dartnall's observation (1953) that their absorbance spectra have the same shape when
plotted on a scale of frequency rather than wavelength. Any visual pigment may be described therefore by specifying the prosthetic group
(retinene, or retinene,) and the wavelength of maximal absorbance
(h,,,,,). The absorbance spectrum of any retinene, pigment can be constructed from the nomogram devised by Dartnall (1953). Retinene, pigments have a somewhat broader absorbance spectrum (Bridges, 1967)
and require a different nomogram (Munz and Schwanzara, 1967). In
favorable cases, appropriate nomogram curves can be fitted to both components in a mixture of visual pigments (Fig. 8). If individuals of a particular species possess mixtures of two known visual pigments (such as a
rhodopsin-porphyropsin pair, based on the same opsin) , the proportions
of the two can be estimated (Dartnall et al., 1961; Munz and Beatty,
1965).
2. ANALYSIS OF RETINENES
Two colorimetric methods are used to analyze retinene. In the CarrPrice reaction, a characteristic blue color appears after an antimony tri-
500
600
Wavelength (nm)
Fig. 8. Identification of A,,,,, of the visual pigment pair extracted from Ctenohrycon. Curve 1, difference spectrum (curve 3-4 from Fig. 7 B ) ; curve 2, constructed
from Dartnall's nomogram assuming A, , , : , , equal to 503 nm. Curve 3, difference spectrum (curve 1-2 from Fig. 7B); curve 4, constructed from the nomogram of Munz
and Schwanzara, assuming A,,,3x equal to 527 nm. Each curve scaled to 100% at its
maximum. From Schwanzara ( 1967 ).
found so often that Dartnall and Lythgoe (1965) regarded partial bleaching as a necessary part of the characterization of any visual pigment.
Identification of visual pigments is facilitated by Dartnall's observation (1953) that their absorbance spectra have the same shape when
plotted on a scale of frequency rather than wavelength. Any visual pigment may be described therefore by specifying the prosthetic group
(retinene, or retinene,) and the wavelength of maximal absorbance
(h,,,,,). The absorbance spectrum of any retinene, pigment can be constructed from the nomogram devised by Dartnall (1953). Retinene, pigments have a somewhat broader absorbance spectrum (Bridges, 1967)
and require a different nomogram (Munz and Schwanzara, 1967). In
favorable cases, appropriate nomogram curves can be fitted to both components in a mixture of visual pigments (Fig. 8). If individuals of a particular species possess mixtures of two known visual pigments (such as a
rhodopsin-porphyropsin pair, based on the same opsin) , the proportions
of the two can be estimated (Dartnall et al., 1961; Munz and Beatty,
1965).
2. ANALYSIS OF RETINENES
Two colorimetric methods are used to analyze retinene. In the CarrPrice reaction, a characteristic blue color appears after an antimony tri-