

296
J. DIAMOND
I
-0.43
-0.42
-0.28
-0.23
-0.1 0
Control. stirn
+0.221 1 1 l - 0 . 1 2
+012
1-0.02
+0.081
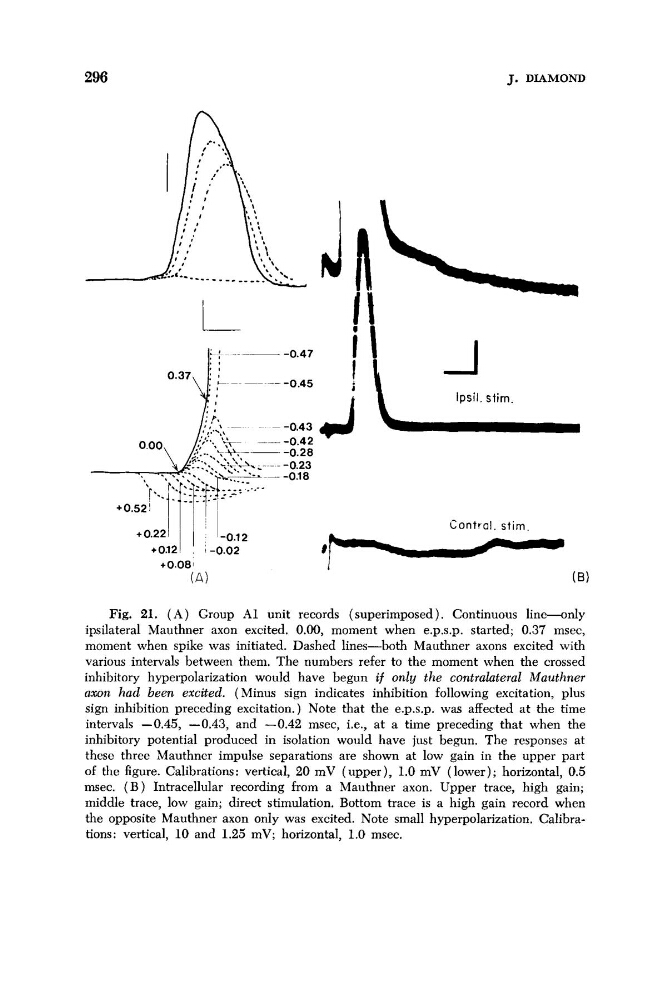
Fig. 21. ( A ) Group A1 unit records (superimposed). Continuous line-only
ipsilateral Mauthner axon excited. 0.00, moment when e.p.s.p. started; 0.37 msec,
moment when spike was initiated. Dashed lines-both
Mauthner axons excited with
various intervals between them. The numbers refer to the moment when the crossed
inhibitory hyperpolarization would have begun if only the contralateral Mauthner
aaon had been excited. ( Minus sign indicates inhibition following excitation, plus
sign inhibition preceding excitation.) Note that the e.p.s.p. was affected at the time
intervals -0.45, -0.43, and -0.42 msec, i.e., at a time preceding that when the
inhibitory potential produced in isolation would have just begun. The responses at
these three Mauthner impulse separations are shown at low gain in the upper part
of the figure. Calibrations: vertical, 20 mV (upper), 1.0 mV (lower); horizontal, 0.5
msec. ( B ) Intracellular recording from a Mauthner axon. Upper trace, high gain;
middle trace, low gain; direct stimulation. Bottom trace is a high gain record when
the opposite Mauthner axon only was excited. Note small hyperpolarization. Calibrations: vertical, 10 and 1.25 mV; horizontal, 1.0 msec.
J. DIAMOND
I
-0.43
-0.42
-0.28
-0.23
-0.1 0
Control. stirn
+0.221 1 1 l - 0 . 1 2
+012
1-0.02
+0.081
Fig. 21. ( A ) Group A1 unit records (superimposed). Continuous line-only
ipsilateral Mauthner axon excited. 0.00, moment when e.p.s.p. started; 0.37 msec,
moment when spike was initiated. Dashed lines-both
Mauthner axons excited with
various intervals between them. The numbers refer to the moment when the crossed
inhibitory hyperpolarization would have begun if only the contralateral Mauthner
aaon had been excited. ( Minus sign indicates inhibition following excitation, plus
sign inhibition preceding excitation.) Note that the e.p.s.p. was affected at the time
intervals -0.45, -0.43, and -0.42 msec, i.e., at a time preceding that when the
inhibitory potential produced in isolation would have just begun. The responses at
these three Mauthner impulse separations are shown at low gain in the upper part
of the figure. Calibrations: vertical, 20 mV (upper), 1.0 mV (lower); horizontal, 0.5
msec. ( B ) Intracellular recording from a Mauthner axon. Upper trace, high gain;
middle trace, low gain; direct stimulation. Bottom trace is a high gain record when
the opposite Mauthner axon only was excited. Note small hyperpolarization. Calibrations: vertical, 10 and 1.25 mV; horizontal, 1.0 msec.