

a
I
I
I
I
I
I
I
I
I
I
I
I
I
I
I
I
I
I
I
b
I
I
I
I
I
I
I
'.-A
C
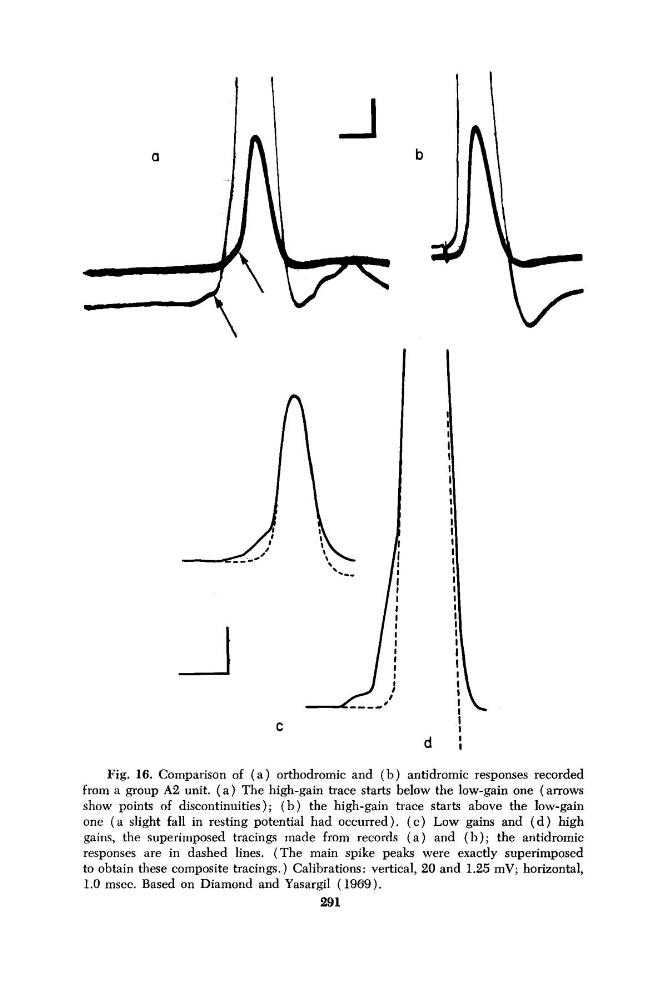
Fig. 16. Comparison of ( a ) orthodromic and ( b ) antidromic responses recorded
from a group A2 unit. ( a ) The high-gain trace starts below the low-gain one (arrows
show points of discontinuities); ( b ) the high-gain trace starts above the low-gain
one ( a slight fall in resting potential had occurred). ( c ) Low gains and ( d ) high
gains, the superimposed tracings made from records ( a ) and ( b ) ; the antidromic
responses are in dashed lines. (The main spike peaks were exactly superimposed
to obtain these composite tracings.) Calibrations: vertical, 20 and 1.25 mV; horizontal,
1.0 msec. Based on Diamond and Yasargil (1969).
291
I
I
I
I
I
I
I
I
I
I
I
I
I
I
I
I
I
I
I
b
I
I
I
I
I
I
I
'.-A
C
Fig. 16. Comparison of ( a ) orthodromic and ( b ) antidromic responses recorded
from a group A2 unit. ( a ) The high-gain trace starts below the low-gain one (arrows
show points of discontinuities); ( b ) the high-gain trace starts above the low-gain
one ( a slight fall in resting potential had occurred). ( c ) Low gains and ( d ) high
gains, the superimposed tracings made from records ( a ) and ( b ) ; the antidromic
responses are in dashed lines. (The main spike peaks were exactly superimposed
to obtain these composite tracings.) Calibrations: vertical, 20 and 1.25 mV; horizontal,
1.0 msec. Based on Diamond and Yasargil (1969).
291