

6. SOUND PRODUCTION AND DETECTION
175
. Hoemulon
-40 -301
j
;
:
IJ
I
I
I
I
I
I
J a
100 200
500 lo00 m 5ooo lop00
i 3
Frequency ( Hz)
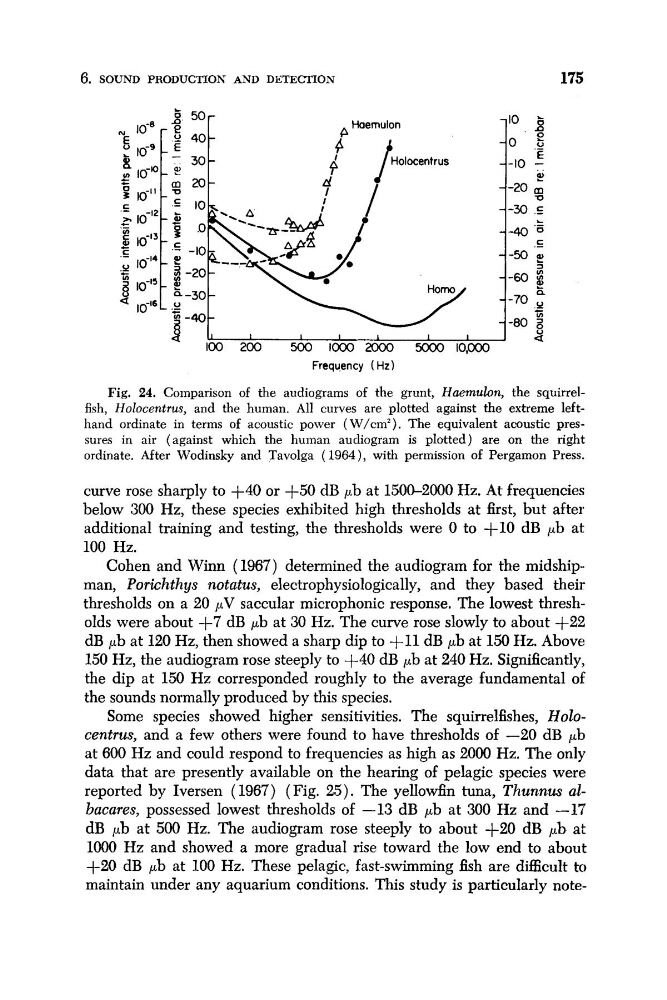
Fig. 24. Comparison of the audiograms of the grunt, Haemulon, the squirrelfish, Holocentrus, and the human. All curves are plotted against the extreme lefthand ordinate in terms of acoustic power (W/cmz). The equivalent acoustic pressures in air (against which the human audiogram is plotted) are on the right
ordinate. After Wodinsky and Tavolga (1964), with permission of Pergamon Press.
curve rose sharply to $40 or +SO dB pb at 1500-2000 Hz. At frequencies
below 300 Hz, these species exhibited high thresholds at first, but after
additional training and testing, the thresholds were 0 to +lo dB pb at
100 Hz.
Cohen and Winn (1967) determined the audiogram for the midshipman, Porichth ys notatus, electrophysiologically, and they based their
thresholds on a 20 p V saccular microphonic response. The lowest thresholds were about +7 dB pb at 30 Hz. The curve rose slowly to about +22
dB pb at 120 Hz, then showed a sharp dip to +11 dB pb at 150 Hz. Above
150 Hz, the audiogram rose steeply to +40 dB pb at 240 Hz. Significantly,
the dip at 150 Hz corresponded roughly to the average fundamental of
the sounds normally produced by this species.
Some species showed higher sensitivities. The squirrelfishes, Holocentrus, and a few others were found to have thresholds of -20 dB pb
at 600 Hz and could respond to frequencies as high as 2000 Hz. The only
data that are presently available on the hearing of pelagic species were
reported by Iversen ( 1967) (Fig. 25). The yellowfin tuna, Thunnus albacares, possessed lowest thresholds of -13 dB pb at 300 Hz and -17
dB pb at 500 Hz. The audiogram rose steeply to about +20 dB pb at
1000 Hz and showed a more gradual rise toward the low end to about
+20 dB pb at 100 Hz. These pelagic, fast-swimming fish are difficult to
maintain under any aquarium conditions. This study is particularly note-
175
. Hoemulon
-40 -301
j
;
:
IJ
I
I
I
I
I
I
J a
100 200
500 lo00 m 5ooo lop00
i 3
Frequency ( Hz)
Fig. 24. Comparison of the audiograms of the grunt, Haemulon, the squirrelfish, Holocentrus, and the human. All curves are plotted against the extreme lefthand ordinate in terms of acoustic power (W/cmz). The equivalent acoustic pressures in air (against which the human audiogram is plotted) are on the right
ordinate. After Wodinsky and Tavolga (1964), with permission of Pergamon Press.
curve rose sharply to $40 or +SO dB pb at 1500-2000 Hz. At frequencies
below 300 Hz, these species exhibited high thresholds at first, but after
additional training and testing, the thresholds were 0 to +lo dB pb at
100 Hz.
Cohen and Winn (1967) determined the audiogram for the midshipman, Porichth ys notatus, electrophysiologically, and they based their
thresholds on a 20 p V saccular microphonic response. The lowest thresholds were about +7 dB pb at 30 Hz. The curve rose slowly to about +22
dB pb at 120 Hz, then showed a sharp dip to +11 dB pb at 150 Hz. Above
150 Hz, the audiogram rose steeply to +40 dB pb at 240 Hz. Significantly,
the dip at 150 Hz corresponded roughly to the average fundamental of
the sounds normally produced by this species.
Some species showed higher sensitivities. The squirrelfishes, Holocentrus, and a few others were found to have thresholds of -20 dB pb
at 600 Hz and could respond to frequencies as high as 2000 Hz. The only
data that are presently available on the hearing of pelagic species were
reported by Iversen ( 1967) (Fig. 25). The yellowfin tuna, Thunnus albacares, possessed lowest thresholds of -13 dB pb at 300 Hz and -17
dB pb at 500 Hz. The audiogram rose steeply to about +20 dB pb at
1000 Hz and showed a more gradual rise toward the low end to about
+20 dB pb at 100 Hz. These pelagic, fast-swimming fish are difficult to
maintain under any aquarium conditions. This study is particularly note-