

176
WILLIAM N. TAVOLGA
1000 2000
Frequency (Hz)
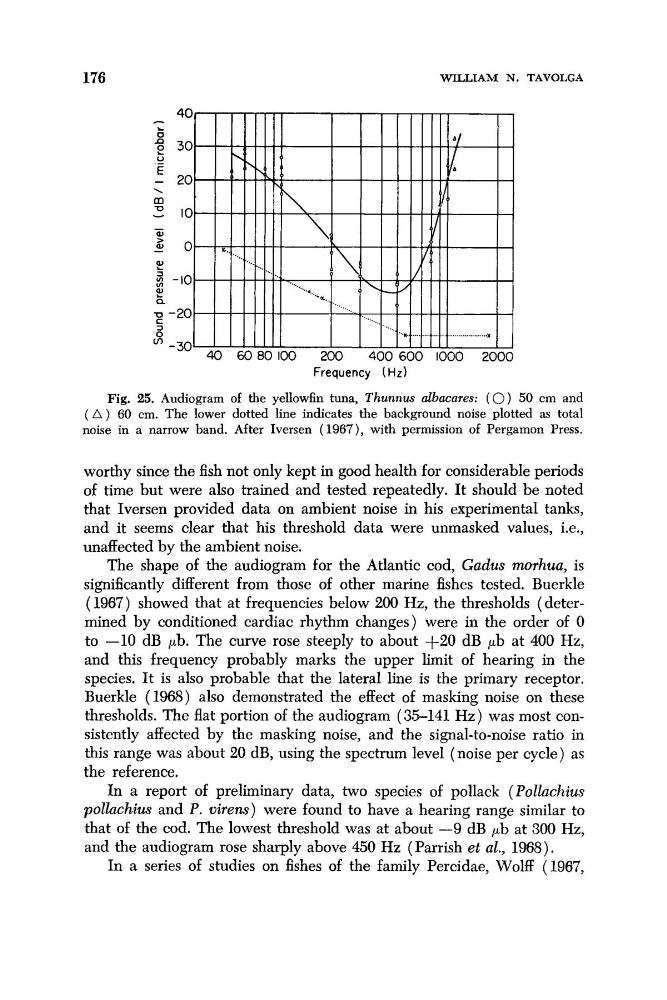
Fig. 25. Audiogram of the yellowfin tuna, Thunnus albacares: ( 0) 50 cm and
( A ) 60 cm. The lower dotted line indicates the background noise plotted as total
noise in a narrow band. After Iversen (1967), with permission of Pergamon Press.
worthy since the fish not only kept in good health for considerable periods
of time but were also trained and tested repeatedly. It should be noted
that Iversen provided data on ambient noise in his experimental tanks,
and it seems clear that his threshold data were unmasked values, i.e.,
unaffected by the ambient noise.
The shape of the audiogram for the Atlantic cod, Gadus nwrhua, is
significantly different from those of other marine fishes tested. Buerkle
( 1967) showed that at frequencies below 200 Hz, the thresholds (determined by conditioned cardiac rhythm changes) were in the order of 0
to -10 dB pb. The curve rose steeply to about +20 dB pb at 400 Hz,
and this frequency probably marks the upper limit of hearing in the
species. It is also probable that the lateral line is the primary receptor.
Buerkle (1968) also demonstrated the effect of masking noise on these
thresholds. The flat portion of the audiogram (35-141 Hz) was most consistently affected by the masking noise, and the signal-to-noise ratio in
this range was about 20 dB, using the spectrum level (noise per cycle) as
the reference.
In a report of preliminary data, two species of pollack (Pollachius
pollachius and P. virens) were found to have a hearing range similar to
that of the cod. The lowest threshold was at about -9 dB pb at 300 Hz,
and the audiogram rose sharply above 450 Hz (Parrish et al., 1968).
In a series of studies on fishes of the family Percidae, Wolff (1967,
WILLIAM N. TAVOLGA
1000 2000
Frequency (Hz)
Fig. 25. Audiogram of the yellowfin tuna, Thunnus albacares: ( 0) 50 cm and
( A ) 60 cm. The lower dotted line indicates the background noise plotted as total
noise in a narrow band. After Iversen (1967), with permission of Pergamon Press.
worthy since the fish not only kept in good health for considerable periods
of time but were also trained and tested repeatedly. It should be noted
that Iversen provided data on ambient noise in his experimental tanks,
and it seems clear that his threshold data were unmasked values, i.e.,
unaffected by the ambient noise.
The shape of the audiogram for the Atlantic cod, Gadus nwrhua, is
significantly different from those of other marine fishes tested. Buerkle
( 1967) showed that at frequencies below 200 Hz, the thresholds (determined by conditioned cardiac rhythm changes) were in the order of 0
to -10 dB pb. The curve rose steeply to about +20 dB pb at 400 Hz,
and this frequency probably marks the upper limit of hearing in the
species. It is also probable that the lateral line is the primary receptor.
Buerkle (1968) also demonstrated the effect of masking noise on these
thresholds. The flat portion of the audiogram (35-141 Hz) was most consistently affected by the masking noise, and the signal-to-noise ratio in
this range was about 20 dB, using the spectrum level (noise per cycle) as
the reference.
In a report of preliminary data, two species of pollack (Pollachius
pollachius and P. virens) were found to have a hearing range similar to
that of the cod. The lowest threshold was at about -9 dB pb at 300 Hz,
and the audiogram rose sharply above 450 Hz (Parrish et al., 1968).
In a series of studies on fishes of the family Percidae, Wolff (1967,