

196
C. ALBERS
and of separated plasma have one point in common: This is the point
of the CO, tension where the separation of red cells and plasma has
taken place. Examples of the different CO, combining curves of true
and separated plasma are given in Fig. 10 for the dogfish, Scyliorhinus
stelluris. Differences between true plasma and separated plasma have
been reported for the carp and the trout (Black et al., 1959). No marked
differences in the buffer capacity of true and separated plasma are found
in the spiny dogfish (Lenfant and Johansen, 1966).
B. The pH of the Blood as Related to CO,
1. THE pH - LOG pco, DIAGRAM
The foregoing sections dealt with the transport of C 0 2 by the blood.
In this section we shall discuss how C 0 2 affects the blood pH. The
concentrations of physically dissolved and chemically bound CO, are
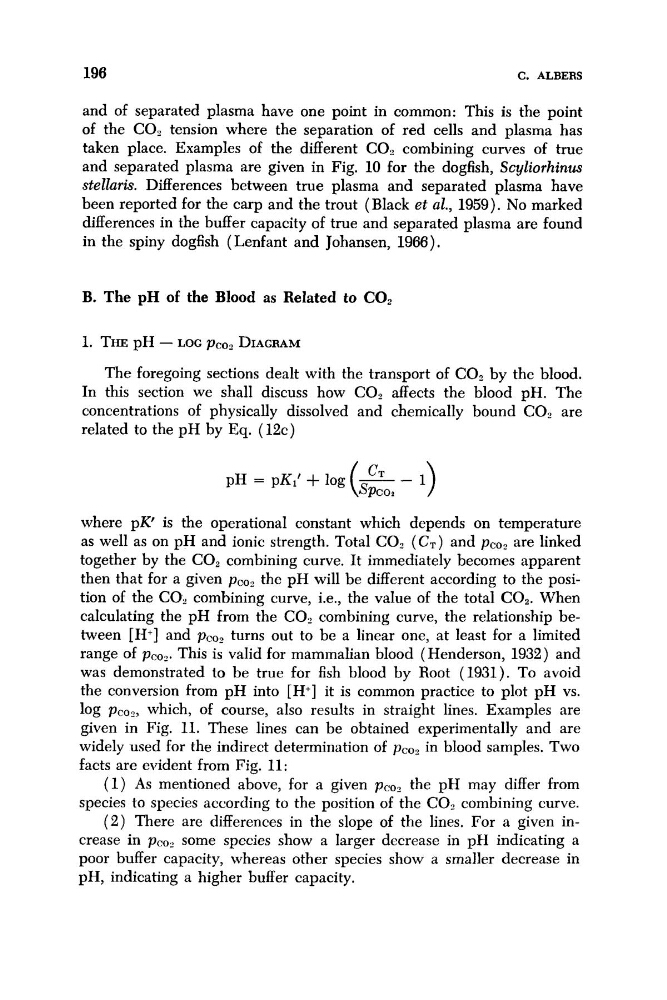
related to the pH by Eq. (12c)
where pK‘ is the operational constant which depends on temperature
as well as on pH and ionic strength. Total CO, ( C , ) and pco2 are linked
together by the CO, combining curve. It immediately becomes apparent
then that for a given pco2 the pH will be different according to the position of the CO, combining curve, i.e., the value of the total CO,. When
calculating the pH from the CO, combining curve, the relationship between [H’] and pco2 turns out to be a linear one, at least for a limited
range of pm2. This is valid for mammalian blood (Henderson, 1932) and
was demonstrated to be true for fish blood by Root (1931). To avoid
the conversion from pH into [ H I it is common practice to plot pH vs.
log pco,, which, of course, also results in straight lines. Examples are
given in Fig. 11. These lines can be obtained experimentally and are
widely used for the indirect determination of pco2 in blood samples. TWO
facts are evident from Fig. 11:
(1) As mentioned above, for a given pco, the pH may differ from
species to species according to the position of the CO, combining curve.
( 2 ) There are differences in the slope of the lines. For a given increase in pm, some species show a larger decrease in pH indicating a
poor buffer capacity, whereas other species show a smaller decrease in
pH, indicating a higher buffer capacity.
C. ALBERS
and of separated plasma have one point in common: This is the point
of the CO, tension where the separation of red cells and plasma has
taken place. Examples of the different CO, combining curves of true
and separated plasma are given in Fig. 10 for the dogfish, Scyliorhinus
stelluris. Differences between true plasma and separated plasma have
been reported for the carp and the trout (Black et al., 1959). No marked
differences in the buffer capacity of true and separated plasma are found
in the spiny dogfish (Lenfant and Johansen, 1966).
B. The pH of the Blood as Related to CO,
1. THE pH - LOG pco, DIAGRAM
The foregoing sections dealt with the transport of C 0 2 by the blood.
In this section we shall discuss how C 0 2 affects the blood pH. The
concentrations of physically dissolved and chemically bound CO, are
related to the pH by Eq. (12c)
where pK‘ is the operational constant which depends on temperature
as well as on pH and ionic strength. Total CO, ( C , ) and pco2 are linked
together by the CO, combining curve. It immediately becomes apparent
then that for a given pco2 the pH will be different according to the position of the CO, combining curve, i.e., the value of the total CO,. When
calculating the pH from the CO, combining curve, the relationship between [H’] and pco2 turns out to be a linear one, at least for a limited
range of pm2. This is valid for mammalian blood (Henderson, 1932) and
was demonstrated to be true for fish blood by Root (1931). To avoid
the conversion from pH into [ H I it is common practice to plot pH vs.
log pco,, which, of course, also results in straight lines. Examples are
given in Fig. 11. These lines can be obtained experimentally and are
widely used for the indirect determination of pco2 in blood samples. TWO
facts are evident from Fig. 11:
(1) As mentioned above, for a given pco, the pH may differ from
species to species according to the position of the CO, combining curve.
( 2 ) There are differences in the slope of the lines. For a given increase in pm, some species show a larger decrease in pH indicating a
poor buffer capacity, whereas other species show a smaller decrease in
pH, indicating a higher buffer capacity.