

260
HILARY B. MOORE
on a few species, but are sufficient to compare a cooler with a warmer
group, and the coefficients for these are 0.27 and 0.43 respectively.
In all the facets examined, variability increases towards the tropics.
It seems improbable that the errors which we have discussed arising
from non-comparability of samples could produce such similarity of
pattern, and we feel that variability may be accepted as one more
indication of stress in the tropics.
J. Breeding
Many published lists of breeding seasons are just as misleading aa
those of longevity and are not safe to use without checking the original
data. Frequently they reflect only the times at which particular workers
were examining a species, and the apparent non-spawning seasons were
really times when nobody was working on the species. We have
endeavored to include only records where there were year round
observations. Even then, seasons defined in terms of ripeness are not
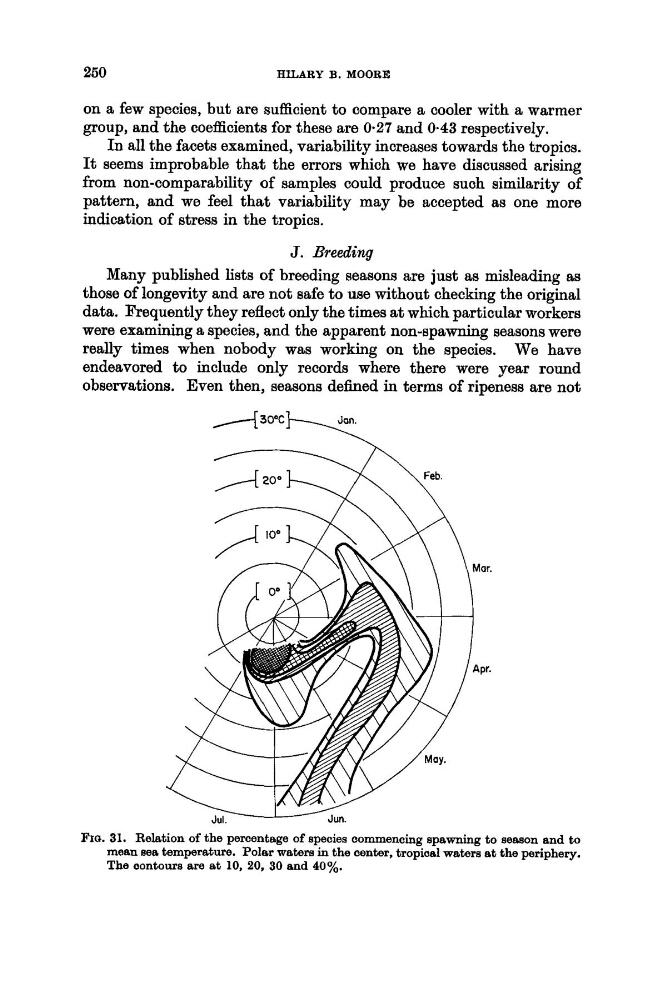
FIG. 31. Relation of the percentage of species aommencing spawning to season and to
mean ma temperature. Poler waters i n the aenter, tropical waters at the periphery.
The oontours are at 10, 20, 30 and 40%.
HILARY B. MOORE
on a few species, but are sufficient to compare a cooler with a warmer
group, and the coefficients for these are 0.27 and 0.43 respectively.
In all the facets examined, variability increases towards the tropics.
It seems improbable that the errors which we have discussed arising
from non-comparability of samples could produce such similarity of
pattern, and we feel that variability may be accepted as one more
indication of stress in the tropics.
J. Breeding
Many published lists of breeding seasons are just as misleading aa
those of longevity and are not safe to use without checking the original
data. Frequently they reflect only the times at which particular workers
were examining a species, and the apparent non-spawning seasons were
really times when nobody was working on the species. We have
endeavored to include only records where there were year round
observations. Even then, seasons defined in terms of ripeness are not
FIG. 31. Relation of the percentage of species aommencing spawning to season and to
mean ma temperature. Poler waters i n the aenter, tropical waters at the periphery.
The oontours are at 10, 20, 30 and 40%.