

ASPECITS OF STRESS IN THE TROPICAL MARINE ENVIRONMENT
249
When these data were plotted, as in Fig. 21, a good approximation of a
straight line was obtained, and from this it was easy to read one
standard deviation. This is not the standard deviation of the raw data,
but it is a value which allows comparison through an array of values
for groups of species from different localities. The problem of the
shortage of small species still remains. In the complete Plymouth
series, individuals under ten mm comprised 36% of the total. We tried
omitting all species under this size in the other data and replacing them
by 36%. However, this did not change the order of the coefficients of
variation from what was obtained without the correction, so the data
I
0
1 0
20
30
.25 1
Ternperoture -OC
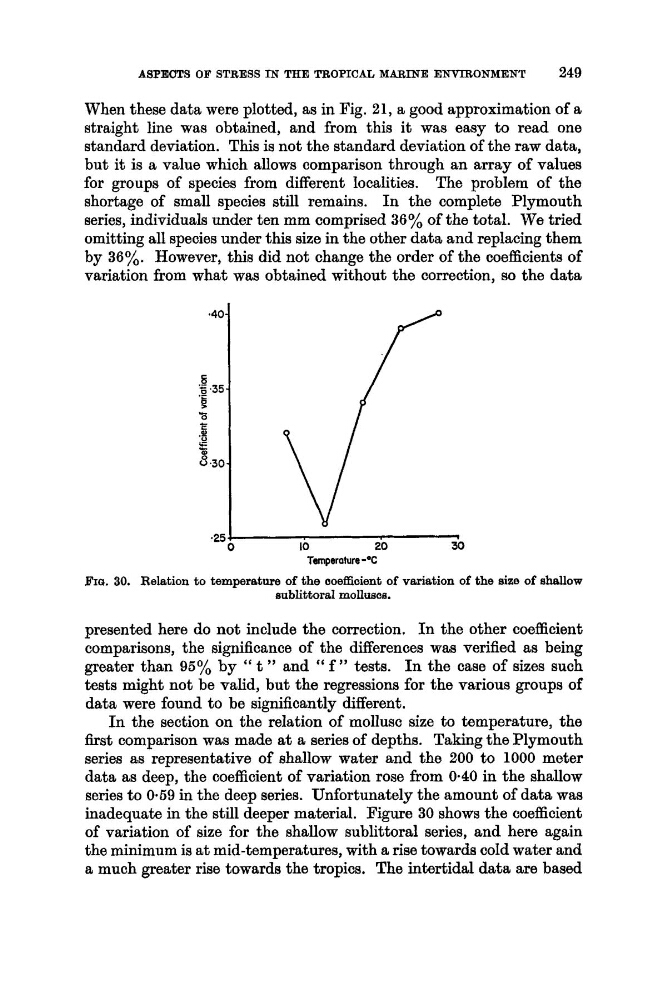
BIQ. 30. Relation to temperature of the ooeffioient of variation of the size of shallow
sublittoral molluscs.
presented here do not include the correction. In the other coefficient
comparisons, the significance of the differences was verified as being
greater than 95% by " t " and " f " tests. I n the case of sizes such
teats might not be valid, but the regressions for the various groups of
data were found to be significantly different.
In the section on the relation of mollusc size to temperature, the
f i s t comparison was made at a series of depths. Taking the Plymouth
series as representative of shallow water and the 200 to 1000 meter
data as deep, the coefficient of variation rose from 0.40 in the shallow
series to 0.59 in the deep aeries. Unfortunately the amount of data was
inadequate in the still deeper material. Figure 30 shows the coefficient
of variation of size for the shallow sublittoral series, and here again
the minimum is at mid-temperatures, with a rise towards cold water and
a much greater rise towards the tropics. The intertidal data are based
249
When these data were plotted, as in Fig. 21, a good approximation of a
straight line was obtained, and from this it was easy to read one
standard deviation. This is not the standard deviation of the raw data,
but it is a value which allows comparison through an array of values
for groups of species from different localities. The problem of the
shortage of small species still remains. In the complete Plymouth
series, individuals under ten mm comprised 36% of the total. We tried
omitting all species under this size in the other data and replacing them
by 36%. However, this did not change the order of the coefficients of
variation from what was obtained without the correction, so the data
I
0
1 0
20
30
.25 1
Ternperoture -OC
BIQ. 30. Relation to temperature of the ooeffioient of variation of the size of shallow
sublittoral molluscs.
presented here do not include the correction. In the other coefficient
comparisons, the significance of the differences was verified as being
greater than 95% by " t " and " f " tests. I n the case of sizes such
teats might not be valid, but the regressions for the various groups of
data were found to be significantly different.
In the section on the relation of mollusc size to temperature, the
f i s t comparison was made at a series of depths. Taking the Plymouth
series as representative of shallow water and the 200 to 1000 meter
data as deep, the coefficient of variation rose from 0.40 in the shallow
series to 0.59 in the deep aeries. Unfortunately the amount of data was
inadequate in the still deeper material. Figure 30 shows the coefficient
of variation of size for the shallow sublittoral series, and here again
the minimum is at mid-temperatures, with a rise towards cold water and
a much greater rise towards the tropics. The intertidal data are based