

70
GORDON A. RILEY
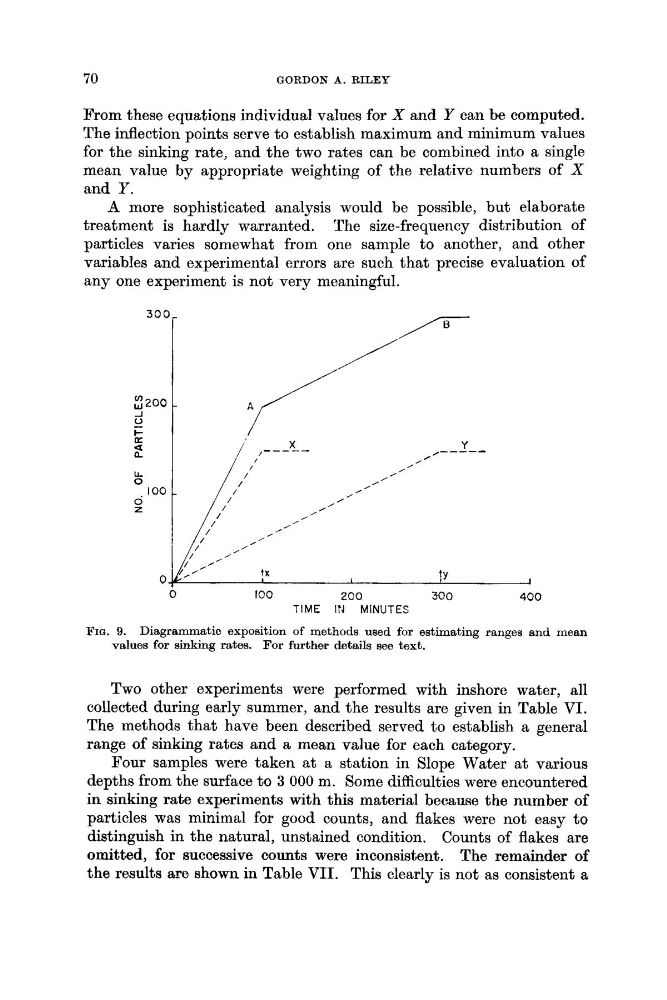
From these equations individual values for X and Y can be computed.
The inflection points serve to establish maximum and minimum values
for the sinking rate, and the two rates can be combined into a single
mean value by appropriate weighting of the relative numbers of X
and Y .
A more sophisticated analysis would be possible, but elaborate
treatment is hardly warranted. The size-frequency distribution of
particles varies somewhat from one sample to another, and other
variables and experimental errors are such that precise evaluation of
any one experiment is not very meaningful.
0
I00
ZOO
300
400
TIME 11. 1 MINUTES
FIG. 9. Diagrammatic exposition of methods used for estimating ranges and mean
values for sinking rates. For further details see text.
Two other experiments were performed with inshore water, all
collected during early summer, and the results are given in Table VI.
The methods that have been described served to establish a general
range of sinking rates and a mean value for each category.
Four samples were taken at a station in Slope Water at various
depths from the surface to 3 000 m. Some difficulties were encountered
in sinking rate experiments with this material because the number of
particles was minimal for good counts, and flakes were not easy to
distinguish in the natural, unstained condition. Counts of flakes are
omitted, for successive counts were inconsistent. The remainder of
the results are shown in Table VII. This clearly is not as consistent a
GORDON A. RILEY
From these equations individual values for X and Y can be computed.
The inflection points serve to establish maximum and minimum values
for the sinking rate, and the two rates can be combined into a single
mean value by appropriate weighting of the relative numbers of X
and Y .
A more sophisticated analysis would be possible, but elaborate
treatment is hardly warranted. The size-frequency distribution of
particles varies somewhat from one sample to another, and other
variables and experimental errors are such that precise evaluation of
any one experiment is not very meaningful.
0
I00
ZOO
300
400
TIME 11. 1 MINUTES
FIG. 9. Diagrammatic exposition of methods used for estimating ranges and mean
values for sinking rates. For further details see text.
Two other experiments were performed with inshore water, all
collected during early summer, and the results are given in Table VI.
The methods that have been described served to establish a general
range of sinking rates and a mean value for each category.
Four samples were taken at a station in Slope Water at various
depths from the surface to 3 000 m. Some difficulties were encountered
in sinking rate experiments with this material because the number of
particles was minimal for good counts, and flakes were not easy to
distinguish in the natural, unstained condition. Counts of flakes are
omitted, for successive counts were inconsistent. The remainder of
the results are shown in Table VII. This clearly is not as consistent a