

PARTICULATE ORGANIC MATTER I N SEA WATER
71
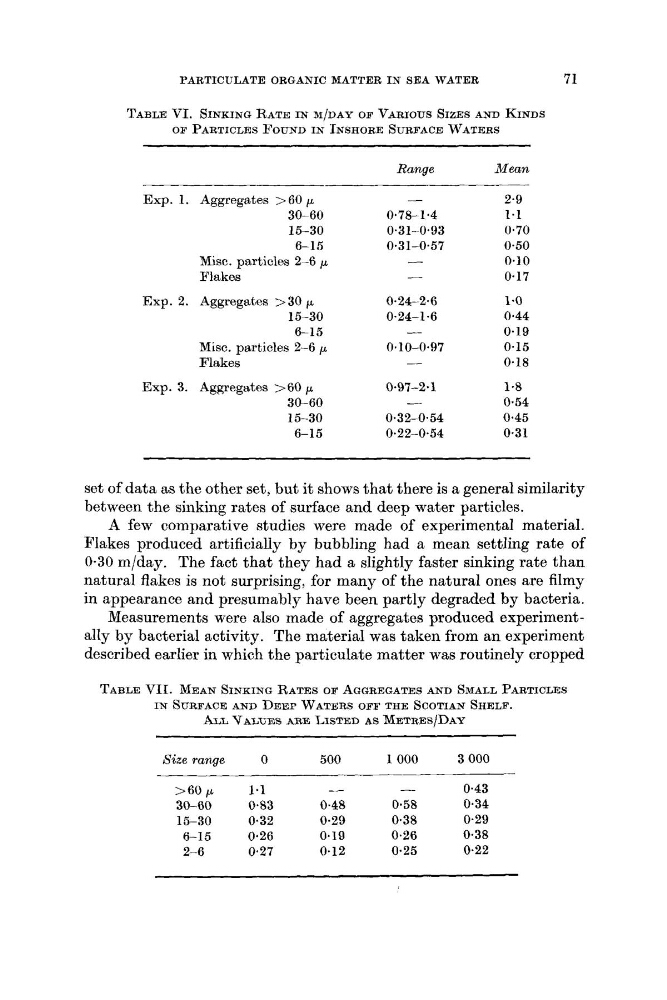
TABLE VI. SINKING RATE IN MIDAY OF VARIOUS SIZES AND KINDS
OF PARTICLES FOUND IN INSHORE SURFACE WATERS
Range
Mean
~~
~~~
~
~
Exp. 1. Aggregates >60 p
-
2.9
30-60
0.78-1'4
1.1
15-30
0.31-0.93
0.70
6-15
0.31-0'57
0.50
Flakes
-
0.17
Mist. particles 2-6 p
-
0.10
Exp. 2. Aggregates >30 p,
0.24-2.6
1-0
15-30
0.24-1 '6
0.44
6-15
-
0.19
Misc. particles 2-6 p
0.10-0.97
0.15
Flakes
-
0.18
Exp. 3. Aggregates >60 p
0.97-2.1
1 .a
30-60
-
0.54
15-30
0.32-0.54
0.45
6-15
0.22-0.54
0.31
set of data as the other set, but it shows that there is a general similarity
between the sinking rates of surface and deep water particles.
A few comparative studies were made of experimental material.
Flakes produced artificially by bubbling had a mean settling rate of
0.30 m/day. The fact that they had a slightly faster sinking rate than
natural flakes is not surprising, for many of the natural ones are filmy
in appearance and presumably have been partly degraded by bacteria.
Measurements were also made of aggregates produced experiment -
ally by bacterial activity. The material was taken from an experiment
described earlier in which the particulate matter was routinely cropped
TABLE VII. MEAN SINKING RATES OF AGGREGATES AND SMALL PARTICLES
IN SURFACE AND DEEP WATERS OFF THE SCOTIAN SHELF.
ALL VALUES ARE LISTED AS METRESIDAY
Size range
0
500
1000
3 000
> 6 0 p
1.1
-
-
0.43
30-60
0.83
0.48
0.58
0.34
15-30
0.32
0.29
0.38
0.29
6-15
0.26
0.19
0.26
0.38
2-6
0.27
0.12
0.25
0.22
71
TABLE VI. SINKING RATE IN MIDAY OF VARIOUS SIZES AND KINDS
OF PARTICLES FOUND IN INSHORE SURFACE WATERS
Range
Mean
~~
~~~
~
~
Exp. 1. Aggregates >60 p
-
2.9
30-60
0.78-1'4
1.1
15-30
0.31-0.93
0.70
6-15
0.31-0'57
0.50
Flakes
-
0.17
Mist. particles 2-6 p
-
0.10
Exp. 2. Aggregates >30 p,
0.24-2.6
1-0
15-30
0.24-1 '6
0.44
6-15
-
0.19
Misc. particles 2-6 p
0.10-0.97
0.15
Flakes
-
0.18
Exp. 3. Aggregates >60 p
0.97-2.1
1 .a
30-60
-
0.54
15-30
0.32-0.54
0.45
6-15
0.22-0.54
0.31
set of data as the other set, but it shows that there is a general similarity
between the sinking rates of surface and deep water particles.
A few comparative studies were made of experimental material.
Flakes produced artificially by bubbling had a mean settling rate of
0.30 m/day. The fact that they had a slightly faster sinking rate than
natural flakes is not surprising, for many of the natural ones are filmy
in appearance and presumably have been partly degraded by bacteria.
Measurements were also made of aggregates produced experiment -
ally by bacterial activity. The material was taken from an experiment
described earlier in which the particulate matter was routinely cropped
TABLE VII. MEAN SINKING RATES OF AGGREGATES AND SMALL PARTICLES
IN SURFACE AND DEEP WATERS OFF THE SCOTIAN SHELF.
ALL VALUES ARE LISTED AS METRESIDAY
Size range
0
500
1000
3 000
> 6 0 p
1.1
-
-
0.43
30-60
0.83
0.48
0.58
0.34
15-30
0.32
0.29
0.38
0.29
6-15
0.26
0.19
0.26
0.38
2-6
0.27
0.12
0.25
0.22