

PARTICnLATE ORGANIC M-4TTER I N SEA WATER
69
5OOr
0
4
8
12
16
20
24
TIME IN HOURS
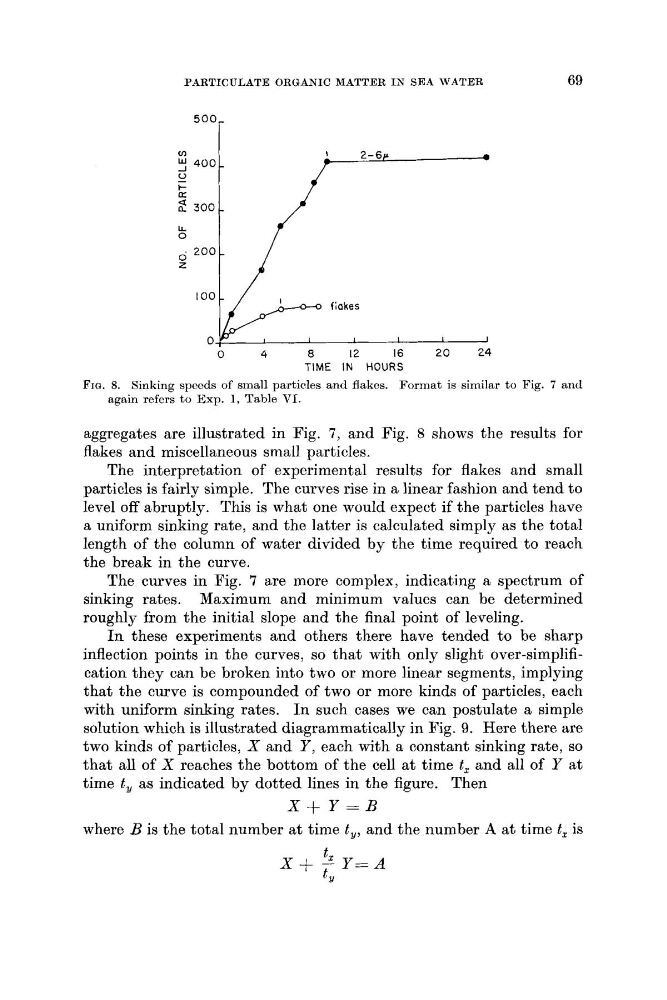
FIG. 8. Sinking speeds of small particles and flakes. Format is similar to Fig. 7 and
again refers t o Exp. 1. Table I7I.
aggregates are illustrated in Fig. 7 , and Fig. 8 shows the results for
flakes and miscellaneous small particles.
The interpretation of experimental results for flakes and small
particles is fairly simple. The curves rise in a linear fashion and tend to
level off abruptly. This is what one would expect if the particles have
a uniform sinking rate, and the latter is calculated simply as the total
length of the column of water divided by the time required to reach
the break in the curve.
The curves in Fig. 7 are more complex, indicating a spectrum of
sinking rates. Maximum and minimum values can be determined
roughly from the initial slope and the final point of leveling.
In these experiments and others there have tended to be sharp
inflection points in the curves, so that with only slight over-simplification they can be broken into two or more linear segments, implying
that the curve is compounded of two or more kinds of particles, each
with uniform sinking rates. I n such cases we can postulate a simple
solution which is illustrated diagrammatically in Fig. 9. Here there are
two kinds of particles, X and Y , each with a constant sinking rate, so
that all of X reaches the bottom of the cell a t time tx and all of Y at
time t , as indicated by dotted lines in the figure. Then
where B is the total number at time t,, and the number A at time t, is
X + Y = B
69
5OOr
0
4
8
12
16
20
24
TIME IN HOURS
FIG. 8. Sinking speeds of small particles and flakes. Format is similar to Fig. 7 and
again refers t o Exp. 1. Table I7I.
aggregates are illustrated in Fig. 7 , and Fig. 8 shows the results for
flakes and miscellaneous small particles.
The interpretation of experimental results for flakes and small
particles is fairly simple. The curves rise in a linear fashion and tend to
level off abruptly. This is what one would expect if the particles have
a uniform sinking rate, and the latter is calculated simply as the total
length of the column of water divided by the time required to reach
the break in the curve.
The curves in Fig. 7 are more complex, indicating a spectrum of
sinking rates. Maximum and minimum values can be determined
roughly from the initial slope and the final point of leveling.
In these experiments and others there have tended to be sharp
inflection points in the curves, so that with only slight over-simplification they can be broken into two or more linear segments, implying
that the curve is compounded of two or more kinds of particles, each
with uniform sinking rates. I n such cases we can postulate a simple
solution which is illustrated diagrammatically in Fig. 9. Here there are
two kinds of particles, X and Y , each with a constant sinking rate, so
that all of X reaches the bottom of the cell a t time tx and all of Y at
time t , as indicated by dotted lines in the figure. Then
where B is the total number at time t,, and the number A at time t, is
X + Y = B