

68
GORDON A. RILEY
particles that were primarily silt or minerals rather than organic
matter.
Initially the cell was filled to a height of 4 cm with a well mixed
suspension, and the chosen area was scanned rapidly at intervals of
5-15 minutes in order to get as much information as possible on the
arrival time of large and rapidly falling particles. After the first hour
or so the counting interval was gradually increased. The time required
for scanning also was longer with the arrival of increasing numbers of
small particles on the bottom. I n each case the time was recorded as
the mid point of the scanning period, but the actual time involved
varied from 2-20 minutes. Counts ordinarily continued for a total
elapsed time of 6-8 hours, with a final check at the end of 24 hours.
Further increases between 8 and 24 hours were slight and were only
in the smallest size category.
3. Results
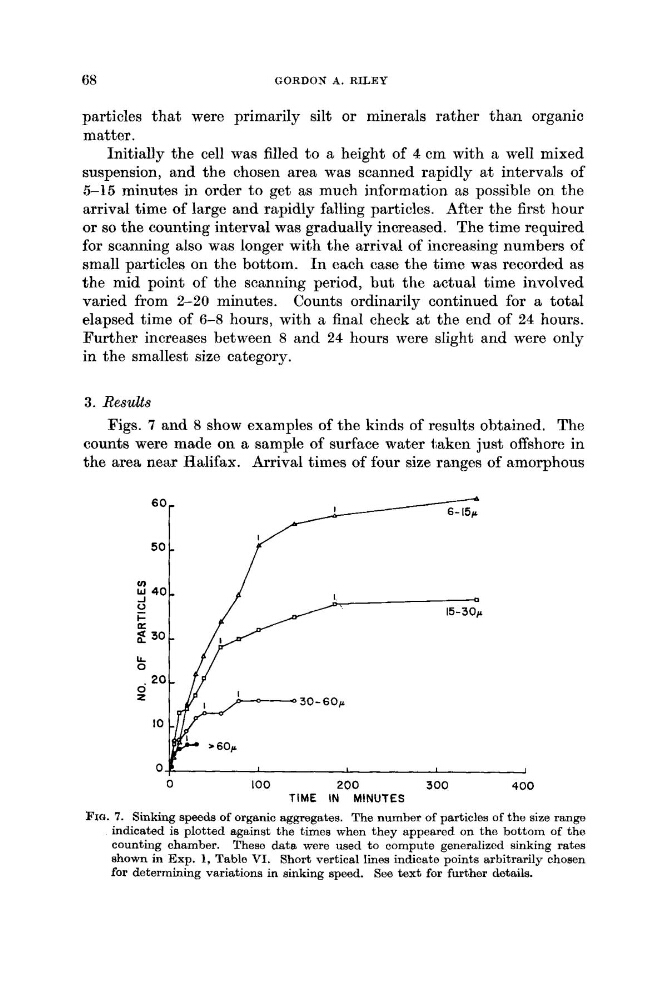
Figs. 7 and 8 show examples of the kinds of results obtained. The
counts were made on a sample of surface water taken just offshore in
the area near Halifax. Arrival times of four size ranges of amorphous
0
100
200
300
400
TIME IN MINUTES
FIG. 7. Sinking speeds of organic aggregates. The number of particles of the size range
indicated is plotted against the times when they appeared on the bottom of the
counting chamber. These data were used to compute generalized sinking rates
shown in Exp. 1, Table VI. Short vertical lines indicate points arbitrarily chosen
for determining variations in sinking speed. See text for further details.
GORDON A. RILEY
particles that were primarily silt or minerals rather than organic
matter.
Initially the cell was filled to a height of 4 cm with a well mixed
suspension, and the chosen area was scanned rapidly at intervals of
5-15 minutes in order to get as much information as possible on the
arrival time of large and rapidly falling particles. After the first hour
or so the counting interval was gradually increased. The time required
for scanning also was longer with the arrival of increasing numbers of
small particles on the bottom. I n each case the time was recorded as
the mid point of the scanning period, but the actual time involved
varied from 2-20 minutes. Counts ordinarily continued for a total
elapsed time of 6-8 hours, with a final check at the end of 24 hours.
Further increases between 8 and 24 hours were slight and were only
in the smallest size category.
3. Results
Figs. 7 and 8 show examples of the kinds of results obtained. The
counts were made on a sample of surface water taken just offshore in
the area near Halifax. Arrival times of four size ranges of amorphous
0
100
200
300
400
TIME IN MINUTES
FIG. 7. Sinking speeds of organic aggregates. The number of particles of the size range
indicated is plotted against the times when they appeared on the bottom of the
counting chamber. These data were used to compute generalized sinking rates
shown in Exp. 1, Table VI. Short vertical lines indicate points arbitrarily chosen
for determining variations in sinking speed. See text for further details.