

316
CHARLES J. RREBS AND JUDITH H. MYERS
1961
1966
1967
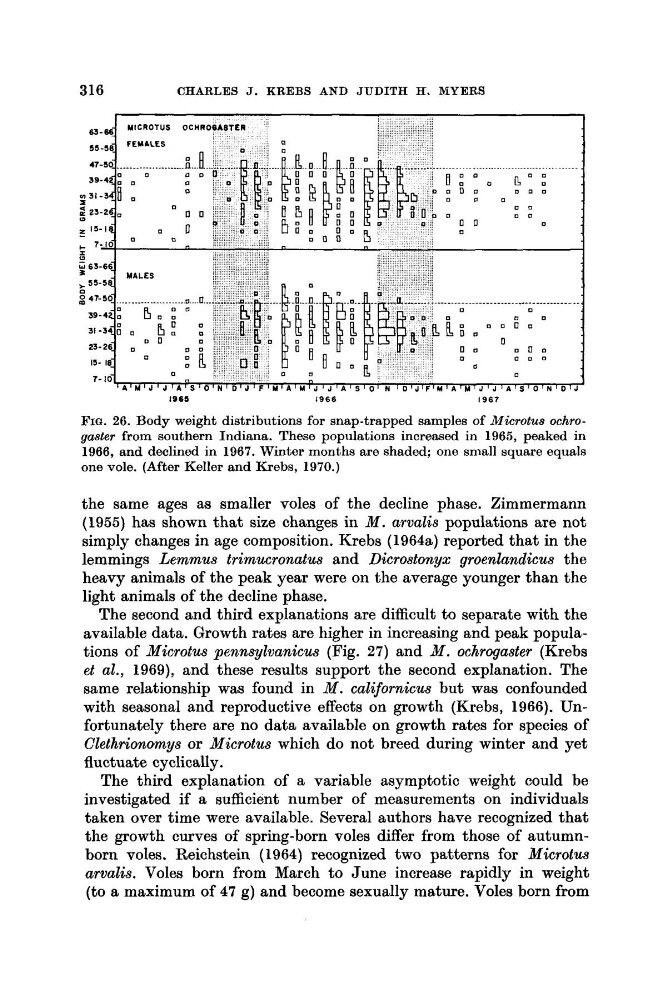
FIG. 26. Body weight distributions for snap-trapped samples of Microtus ochrogaster from southern Indiana. These populations increased in 1965, peaked in
1966, and declined in 1967. Winter months are shaded; one small square equals
one vole. (After Keller and Krebs, 1970.)
the same ages as smaller voles of the decline phase. Zimmermann
(1955) has shown that size changes in M . arvalis populations are not
simply changes in age composition. Krebs (1964a) reported that in the
lemmings Lemmus trimucronatus and Dicrostonyx groenlandicus the
heavy animals of the peak year were on the average younger than the
light animals of the decline phase.
The second and third explanations are difficult to separate with the
available data. Growth rates are higher in increasing and peak populations of Microtus pennsylvanicus (Fig. 27) and M . ochrogaster (Krebs
et al., 1969), and these results support the second explanation. The
same relationship was found in M . californicus but was confounded
with seasonal and reproductive effects on growth (Krebs, 1966). Unfortunately there are no data available on growth rates for species of
Clethrionomys or Microtus which do not breed during winter and yet
fluctuate cyclically.
The third explanation of a variable asymptotic weight could be
investigated if a sufficient number of measurements on individuals
taken over time were available. Several authors have recognized that
the growth curves of spring-born voles differ from those of autumnborn voles. Reichstein (1964) recognized two patterns for Microtus
arvalis. Voles born from March to June increase rapidly in weight
(to a maximum of 47 g) and become sexually mature. Voles born from
CHARLES J. RREBS AND JUDITH H. MYERS
1961
1966
1967
FIG. 26. Body weight distributions for snap-trapped samples of Microtus ochrogaster from southern Indiana. These populations increased in 1965, peaked in
1966, and declined in 1967. Winter months are shaded; one small square equals
one vole. (After Keller and Krebs, 1970.)
the same ages as smaller voles of the decline phase. Zimmermann
(1955) has shown that size changes in M . arvalis populations are not
simply changes in age composition. Krebs (1964a) reported that in the
lemmings Lemmus trimucronatus and Dicrostonyx groenlandicus the
heavy animals of the peak year were on the average younger than the
light animals of the decline phase.
The second and third explanations are difficult to separate with the
available data. Growth rates are higher in increasing and peak populations of Microtus pennsylvanicus (Fig. 27) and M . ochrogaster (Krebs
et al., 1969), and these results support the second explanation. The
same relationship was found in M . californicus but was confounded
with seasonal and reproductive effects on growth (Krebs, 1966). Unfortunately there are no data available on growth rates for species of
Clethrionomys or Microtus which do not breed during winter and yet
fluctuate cyclically.
The third explanation of a variable asymptotic weight could be
investigated if a sufficient number of measurements on individuals
taken over time were available. Several authors have recognized that
the growth curves of spring-born voles differ from those of autumnborn voles. Reichstein (1964) recognized two patterns for Microtus
arvalis. Voles born from March to June increase rapidly in weight
(to a maximum of 47 g) and become sexually mature. Voles born from