

POPULATION CYCLES IN SMALL MAMMALS
305
MlCROTUS PENNSYLVANICUS
GRID I
g 1.0
n
4 .8
n
W
a
w .6
a
a
_I
.4
5
ls
3 .2
u)
z
a 0
A
J
A
O
D
F
A
J
A
O
D
F
A
J
1967
1968
1969
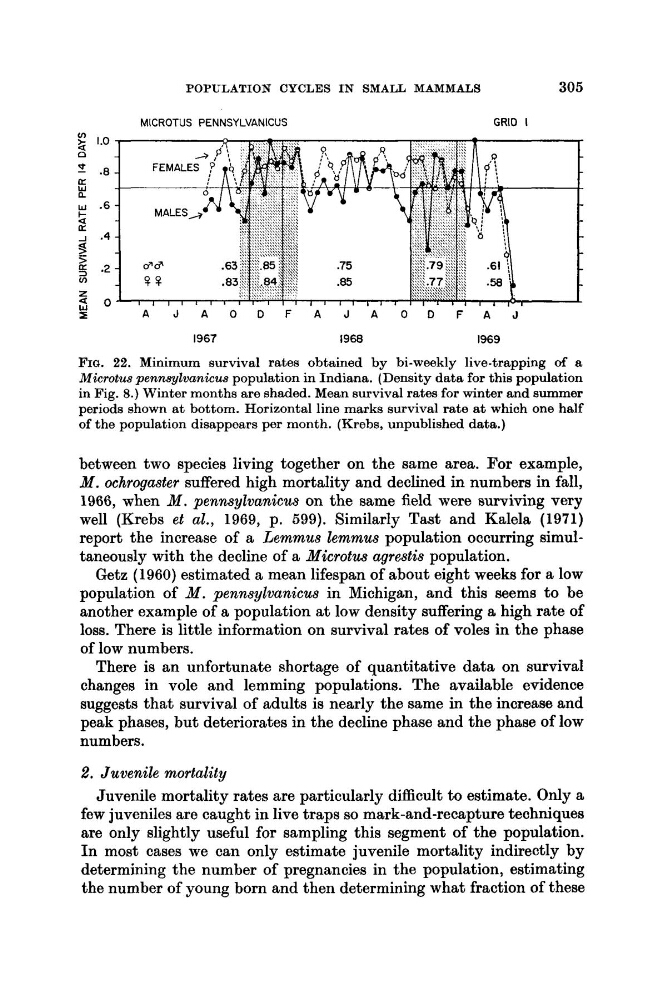
FIU. 22. Minimum survival rates obtained by bi-weekly live-trapping of a
Microtus pennqjlvanicue population in Indiana. (Density data for this population
in Fig. 8.) Winter months are shaded. Mean survival rates for winter and summer
periods shown a t bottom. Horizontal line marks survival rate at which one half
of the population disappears per month. (Krebs, unpublished data.)
between two species living together on the same area. For example,
M . ochrogmter suffered high mortality and declined in numbers in fall,
1966, when M . pennsylvanicus on the same field were surviving very
well (Krebs et al., 1969, p. 599). Similarly Tast and Kalela (1971)
report the increase of a Lemmus lemmus population occurring simultaneously with the decline of a Microtus agrestis population.
Getz (1960) estimated a mean lifespan of about eight weeks for a low
population of M . pennsylvanicus in Michigan, and this seems to be
another example of a population at low density suffering a high rate of
loss. There is little information on survival rates of voles in the phase
of low numbers.
There is an unfortunate shortage of quantitative data on survival
changes in vole and lemming populations. The available evidence
suggests that survival of adults is nearly the same in the increase and
peak phases, but deteriorates in the decline phase and the phase of low
numbers.
2. Juvenile mortality
Juvenile mortality rates are particularly difficult to estimate. Only a
few juveniles are caught in live traps so mark-and-recapture techniques
are only slightly useful for sampling this segment of the population.
In most cases we can only estimate juvenile mortality indirectly by
determining the number of pregnancies in the population, estimating
the number of young born and then determining what fraction of these
305
MlCROTUS PENNSYLVANICUS
GRID I
g 1.0
n
4 .8
n
W
a
w .6
a
a
_I
.4
5
ls
3 .2
u)
z
a 0
A
J
A
O
D
F
A
J
A
O
D
F
A
J
1967
1968
1969
FIU. 22. Minimum survival rates obtained by bi-weekly live-trapping of a
Microtus pennqjlvanicue population in Indiana. (Density data for this population
in Fig. 8.) Winter months are shaded. Mean survival rates for winter and summer
periods shown a t bottom. Horizontal line marks survival rate at which one half
of the population disappears per month. (Krebs, unpublished data.)
between two species living together on the same area. For example,
M . ochrogmter suffered high mortality and declined in numbers in fall,
1966, when M . pennsylvanicus on the same field were surviving very
well (Krebs et al., 1969, p. 599). Similarly Tast and Kalela (1971)
report the increase of a Lemmus lemmus population occurring simultaneously with the decline of a Microtus agrestis population.
Getz (1960) estimated a mean lifespan of about eight weeks for a low
population of M . pennsylvanicus in Michigan, and this seems to be
another example of a population at low density suffering a high rate of
loss. There is little information on survival rates of voles in the phase
of low numbers.
There is an unfortunate shortage of quantitative data on survival
changes in vole and lemming populations. The available evidence
suggests that survival of adults is nearly the same in the increase and
peak phases, but deteriorates in the decline phase and the phase of low
numbers.
2. Juvenile mortality
Juvenile mortality rates are particularly difficult to estimate. Only a
few juveniles are caught in live traps so mark-and-recapture techniques
are only slightly useful for sampling this segment of the population.
In most cases we can only estimate juvenile mortality indirectly by
determining the number of pregnancies in the population, estimating
the number of young born and then determining what fraction of these