

304
CHARLES J. KREBS AND JUDITH H. MYERS
Y
0.6
n
MALES
Q
p:
U J
I
I
I
I
I
I
FEB.
MAR. APR.
M A Y
JUNE JULY
AUG.
1963
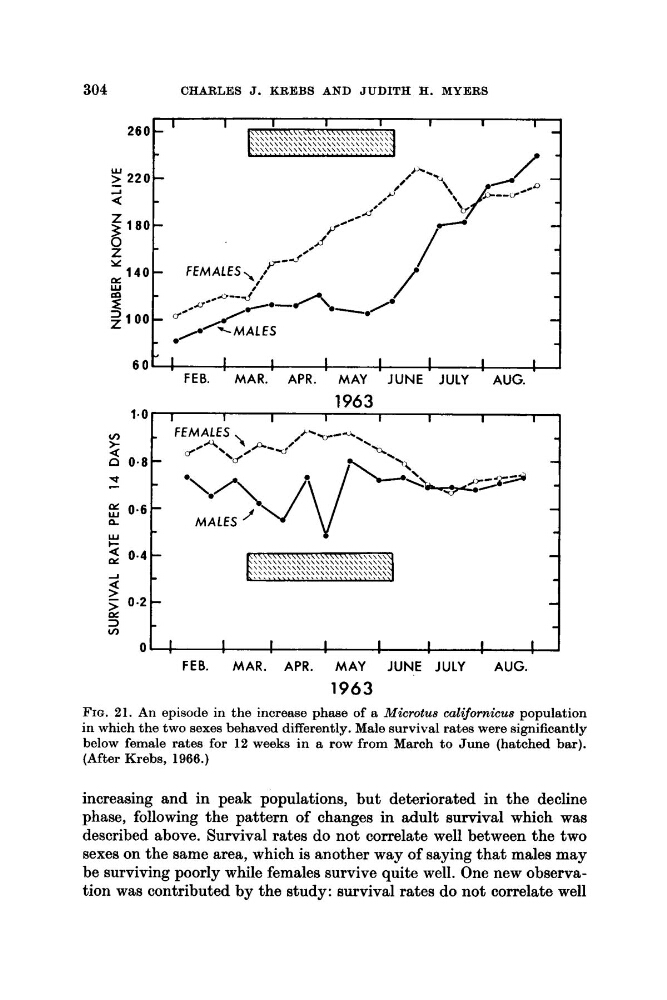
FIG. 21. An episode in the increase phase of a Microtus californicus population
in which the two sexes behaved differently. Male survival rates were significantly
below female rates for 12 weeks in a row from March to June (hatched bar).
(After Krebs, 1966.)
increasing and in peak populations, but deteriorated in the decline
phase, following the pattern of changes in adult survival which was
described above. Survival rates do not correlate well between the two
sexes on the same area, which is another way of saying that males may
be surviving poorly while females survive quite well. One new observation was contributed by the study: survival rates do not correlate well
CHARLES J. KREBS AND JUDITH H. MYERS
Y
0.6
n
MALES
Q
p:
U J
I
I
I
I
I
I
FEB.
MAR. APR.
M A Y
JUNE JULY
AUG.
1963
FIG. 21. An episode in the increase phase of a Microtus californicus population
in which the two sexes behaved differently. Male survival rates were significantly
below female rates for 12 weeks in a row from March to June (hatched bar).
(After Krebs, 1966.)
increasing and in peak populations, but deteriorated in the decline
phase, following the pattern of changes in adult survival which was
described above. Survival rates do not correlate well between the two
sexes on the same area, which is another way of saying that males may
be surviving poorly while females survive quite well. One new observation was contributed by the study: survival rates do not correlate well