

288
CHARLES J. KREBS AND JUDITH H. MYERS
TABLE V (contd.)
Type of
Species
Time period
decline Mean r
Reference
SUMMER DECLINES
Clethrimomys
rmtilus
Clethrionomys
glareolw
Clethrionomys
rufocanw,
Microtus
pennsy lvanicus
Microtw
ochrogaster
Microtw
ugreatis
Microtw,
calqmicus
Lemmus
trimwronatw
Dicrostonyx
gr0enlaTldicw
June-Aug. 1964
April-Oct. 1967
JuneSept. 1956
MarchJuly 1967
Feb.July 1969
Feb.-July 1969
Feb.July 1969
March-Sept. 1967
Feb.-Oct. 1968
March-Aug. 1969
May-Aug. 195 1
May-Aug. 1952
Feb.-July 1964
MarchJuly 1963
Feb.-May 1964
June-Aug. 1961
June-Aug. 1961
H,
+0-180t Koshkina (1965)
HI
+ 0.042 Petrusewicz et al. (1971)
H,
+ 0.062 Kalela (1957)
G
- 0.029 Krebs et al. (1969)
G
- 0.061 Gaines and Krebs (1971)
G
- 0.1 19 Gaines and Krebs (1971)
G or HI? - 0.017 MyersandKrebs (1971b)
M
-0.083
Krebs et al. (1969)
H,
+ 0.023 Gaines and Krebs (1971)
G
- 0.142 MyersandKrebs (1971b)
G
- 0.107 Godfrey (1955)
G
- 0.089 Godfrey (1955)
HI
+0.062
Krebs (1966)
M
-0.185
Krebs (1966)
H,
+0-076 Krebs (1966)
G
-0.124
Krebs (1964e)
G
- 0.131 Krebs (19644
* H, refers to the first year of a Type H decline.
t Note that populations can increase in the summer breeding season of the decline
phaae of Type H.
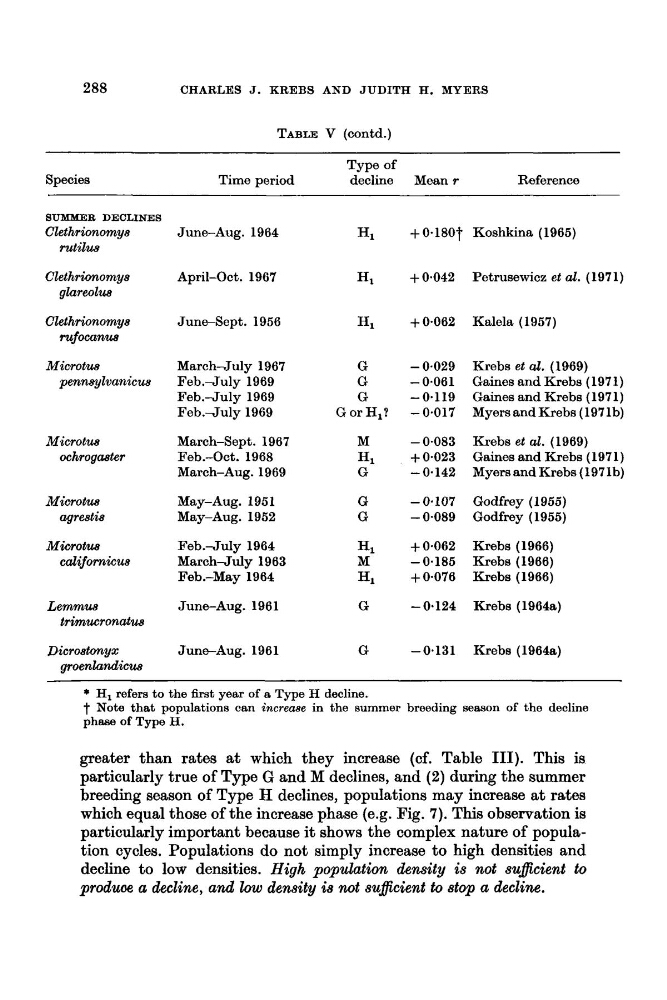
greater than rates at which they increase (cf. Table 111). This is
particularly true of Type G and M declines, and (2) during the summer
breeding season of Type H declines, populations may increase at rates
which equal those of the increase phase (e.g. Fig. 7). This observation is
particularly important because it shows the complex nature of population cycles. Populations do not simply increase to high densities and
decline to low densities. High population density is not suficient to
produoe a decline, and low density is not suflcient to stop a decline.
CHARLES J. KREBS AND JUDITH H. MYERS
TABLE V (contd.)
Type of
Species
Time period
decline Mean r
Reference
SUMMER DECLINES
Clethrimomys
rmtilus
Clethrionomys
glareolw
Clethrionomys
rufocanw,
Microtus
pennsy lvanicus
Microtw
ochrogaster
Microtw
ugreatis
Microtw,
calqmicus
Lemmus
trimwronatw
Dicrostonyx
gr0enlaTldicw
June-Aug. 1964
April-Oct. 1967
JuneSept. 1956
MarchJuly 1967
Feb.July 1969
Feb.-July 1969
Feb.July 1969
March-Sept. 1967
Feb.-Oct. 1968
March-Aug. 1969
May-Aug. 195 1
May-Aug. 1952
Feb.-July 1964
MarchJuly 1963
Feb.-May 1964
June-Aug. 1961
June-Aug. 1961
H,
+0-180t Koshkina (1965)
HI
+ 0.042 Petrusewicz et al. (1971)
H,
+ 0.062 Kalela (1957)
G
- 0.029 Krebs et al. (1969)
G
- 0.061 Gaines and Krebs (1971)
G
- 0.1 19 Gaines and Krebs (1971)
G or HI? - 0.017 MyersandKrebs (1971b)
M
-0.083
Krebs et al. (1969)
H,
+ 0.023 Gaines and Krebs (1971)
G
- 0.142 MyersandKrebs (1971b)
G
- 0.107 Godfrey (1955)
G
- 0.089 Godfrey (1955)
HI
+0.062
Krebs (1966)
M
-0.185
Krebs (1966)
H,
+0-076 Krebs (1966)
G
-0.124
Krebs (1964e)
G
- 0.131 Krebs (19644
* H, refers to the first year of a Type H decline.
t Note that populations can increase in the summer breeding season of the decline
phaae of Type H.
greater than rates at which they increase (cf. Table 111). This is
particularly true of Type G and M declines, and (2) during the summer
breeding season of Type H declines, populations may increase at rates
which equal those of the increase phase (e.g. Fig. 7). This observation is
particularly important because it shows the complex nature of population cycles. Populations do not simply increase to high densities and
decline to low densities. High population density is not suficient to
produoe a decline, and low density is not suflcient to stop a decline.