

POPULATION CYCLES IN SMALL MAMMALS
287
several years in a row during the increase phase, the peak phase, and a
Type H decline. Superficial observations on autumn densities thus
might lead one to conclude that M. agrestis populations do not fluctuate
in cycles.
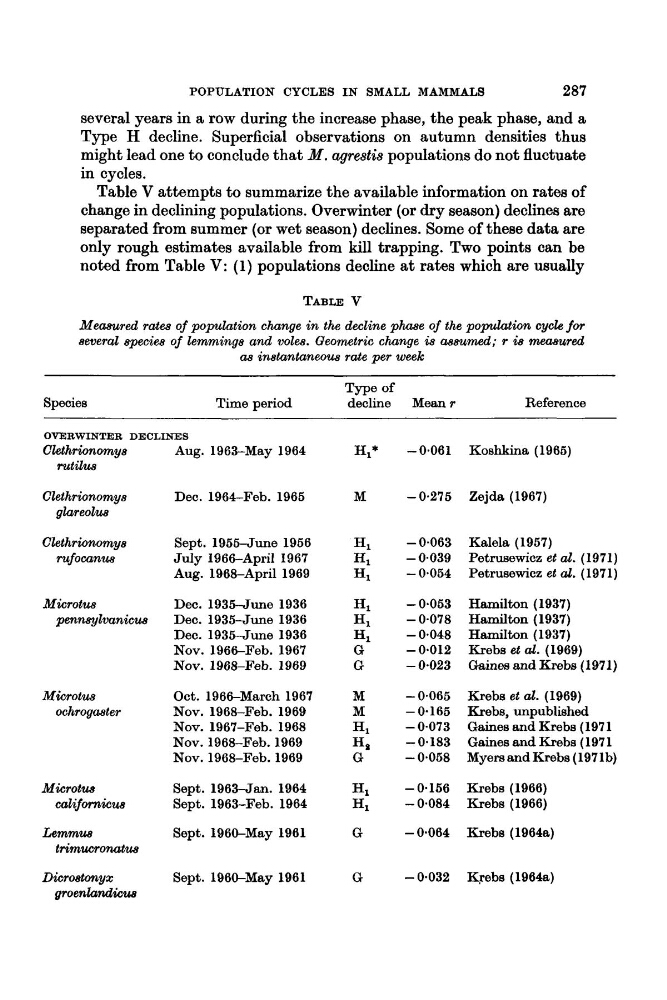
Table V attempts to summarize the available information on rates of
change in declining populations. Overwinter (or dry season) declines are
separated from summer (or wet season) declines. Some of these data are
only rough estimates available from kill trapping. Two points can be
noted from Table V: (1) populations decline at rates which are usually
TABLE V
M e w r e d rates of population chunge in the decline phase of the poplation cycle for
several species of lemmings and voles. Geometric change is aaszcnzed; r is maacncrerl
aa instcmtaneoua rate per week
Species
Type of
Time period
decline Meanr
Reference
OVERWINTER DECLINES
C~ethrionomys
gkcreolua
Clethrwnomys
rufocanua
Microtua
pennsylvanicua
Microtus
ochrogaater
Microtua
ca1qOrnicua
Lemmua
trimucromtua
Dicrostunyx
groenhndicw
Aug. 1963-May 1964
Dec. 1964-Feb. 1965
Sept. 1955-June 1956
July 1966-April 1967
Aug. 1968-April 1969
Dec. 19354une 1936
Dec. 1935June 1936
Dec. 193Wune 1936
Nov. 1966-Feb. 1967
Nov. 1968-Feb. 1969
Oct. 1966-March 1967
Nov. 1967-Feb. 1968
Nov. 1968-Feb. 1969
Nov. 1968-Feb. 1969
NOV. 1968-Feb. 1969
Sept. 1963Jan. 1964
Sept. 1963-Feb. 1964
Sept. 196&May 1961
Sept. 196&May 1961
- 0.061 Koshkina (1965)
- 0.275 Zejda (1967)
- 0.063 Kalela (1957)
- 0.039
- 0.054
- 0.053 Hamilton (1937)
- 0-078 Hamilton (1937)
- 0.048 Hamilton (1937)
- 0.023 Gaines and Krebs (1971)
- 0.065 Krebs et al. (1969)
- 0.165 Krebs, unpublished
- 0.073 Gaines and Krebs (197 1
-0.183
GainesandKrebs (1971
-0.058
MyeraandKrebs(197lb)
- 0.156 Krebs (1966)
Petrusewicz et al. (1971)
Petrusewicz et al. (1971)
- 0.012 &ebS et al. (1969)
- 0.084 Krebs (1966)
- 0.064 KrebS (1964~)
- 0.032 Kpbs (1964a)
287
several years in a row during the increase phase, the peak phase, and a
Type H decline. Superficial observations on autumn densities thus
might lead one to conclude that M. agrestis populations do not fluctuate
in cycles.
Table V attempts to summarize the available information on rates of
change in declining populations. Overwinter (or dry season) declines are
separated from summer (or wet season) declines. Some of these data are
only rough estimates available from kill trapping. Two points can be
noted from Table V: (1) populations decline at rates which are usually
TABLE V
M e w r e d rates of population chunge in the decline phase of the poplation cycle for
several species of lemmings and voles. Geometric change is aaszcnzed; r is maacncrerl
aa instcmtaneoua rate per week
Species
Type of
Time period
decline Meanr
Reference
OVERWINTER DECLINES
C~ethrionomys
gkcreolua
Clethrwnomys
rufocanua
Microtua
pennsylvanicua
Microtus
ochrogaater
Microtua
ca1qOrnicua
Lemmua
trimucromtua
Dicrostunyx
groenhndicw
Aug. 1963-May 1964
Dec. 1964-Feb. 1965
Sept. 1955-June 1956
July 1966-April 1967
Aug. 1968-April 1969
Dec. 19354une 1936
Dec. 1935June 1936
Dec. 193Wune 1936
Nov. 1966-Feb. 1967
Nov. 1968-Feb. 1969
Oct. 1966-March 1967
Nov. 1967-Feb. 1968
Nov. 1968-Feb. 1969
Nov. 1968-Feb. 1969
NOV. 1968-Feb. 1969
Sept. 1963Jan. 1964
Sept. 1963-Feb. 1964
Sept. 196&May 1961
Sept. 196&May 1961
- 0.061 Koshkina (1965)
- 0.275 Zejda (1967)
- 0.063 Kalela (1957)
- 0.039
- 0.054
- 0.053 Hamilton (1937)
- 0-078 Hamilton (1937)
- 0.048 Hamilton (1937)
- 0.023 Gaines and Krebs (1971)
- 0.065 Krebs et al. (1969)
- 0.165 Krebs, unpublished
- 0.073 Gaines and Krebs (197 1
-0.183
GainesandKrebs (1971
-0.058
MyeraandKrebs(197lb)
- 0.156 Krebs (1966)
Petrusewicz et al. (1971)
Petrusewicz et al. (1971)
- 0.012 &ebS et al. (1969)
- 0.084 Krebs (1966)
- 0.064 KrebS (1964~)
- 0.032 Kpbs (1964a)