

248
WILLIAM STREIFER
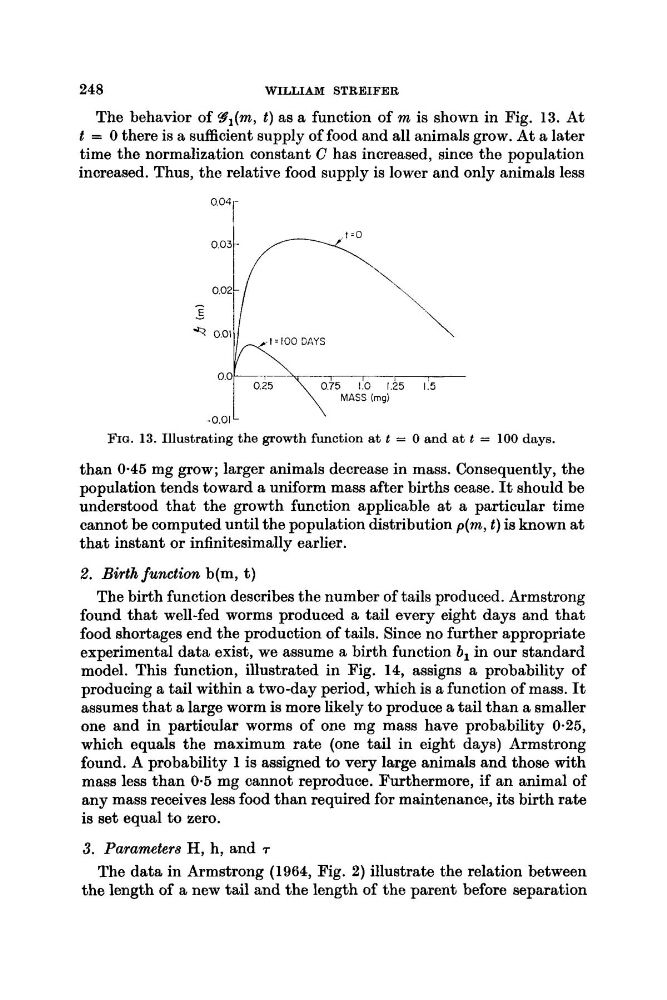
The behavior of Y,(rn, t ) as a function of rn is shown in Fig. 13. At
t = 0 there is a sufficient supply of food and all animals grow. At a later
time the normalization constant C has increased, since the population
increased. Thus, the relative food supply is lower and only animals less
0.041
O
O
~
~
y
i
T
G
T
-
MASS (mg)
-0.01
FIG. 13. Illustrating the growth function at t = 0 and at t = 100 days.
than 0.45 mg grow; larger animals decrease in mass. Consequently, the
population tends toward a uniform mass after births cease. It should be
understood that the growth function applicable at a particular time
cannot be computed until the population distribution p(m, t ) is known at
that instant or infinitesimally earlier.
2. Birth function b(m, t)
The birth function describes the number of tails produced. Armstrong
found that well-fed worms produced a tail every eight days and that
food shortages end the production of tails. Since no further appropriate
experimental data exist, we assume a birth function b, in our standard
model. This function, illustrated in Fig. 14, assigns a probability of
producing a tail within a two-day period, which is a function of mass. It
assumes that a large worm is more likely to produce a tail than a smaller
one and in particular worms of one mg mass have probability 0.25,
which equals the maximum rate (one tail in eight days) Armstrong
found. A probability 1 is assigned to very large animals and those with
mass less than 0.5 mg cannot reproduce. Furthermore, if an animal of
any mass receives less food than required for maintenance, its birth rate
is set equal to zero.
3. Parameters H, h, and T
The data in Armstrong (1964, Fig. 2) illustrate the relation between
the length of a new tail and the length of the parent before separation
WILLIAM STREIFER
The behavior of Y,(rn, t ) as a function of rn is shown in Fig. 13. At
t = 0 there is a sufficient supply of food and all animals grow. At a later
time the normalization constant C has increased, since the population
increased. Thus, the relative food supply is lower and only animals less
0.041
O
O
~
~
y
i
T
G
T
-
MASS (mg)
-0.01
FIG. 13. Illustrating the growth function at t = 0 and at t = 100 days.
than 0.45 mg grow; larger animals decrease in mass. Consequently, the
population tends toward a uniform mass after births cease. It should be
understood that the growth function applicable at a particular time
cannot be computed until the population distribution p(m, t ) is known at
that instant or infinitesimally earlier.
2. Birth function b(m, t)
The birth function describes the number of tails produced. Armstrong
found that well-fed worms produced a tail every eight days and that
food shortages end the production of tails. Since no further appropriate
experimental data exist, we assume a birth function b, in our standard
model. This function, illustrated in Fig. 14, assigns a probability of
producing a tail within a two-day period, which is a function of mass. It
assumes that a large worm is more likely to produce a tail than a smaller
one and in particular worms of one mg mass have probability 0.25,
which equals the maximum rate (one tail in eight days) Armstrong
found. A probability 1 is assigned to very large animals and those with
mass less than 0.5 mg cannot reproduce. Furthermore, if an animal of
any mass receives less food than required for maintenance, its birth rate
is set equal to zero.
3. Parameters H, h, and T
The data in Armstrong (1964, Fig. 2) illustrate the relation between
the length of a new tail and the length of the parent before separation