

220
H. KLOMP
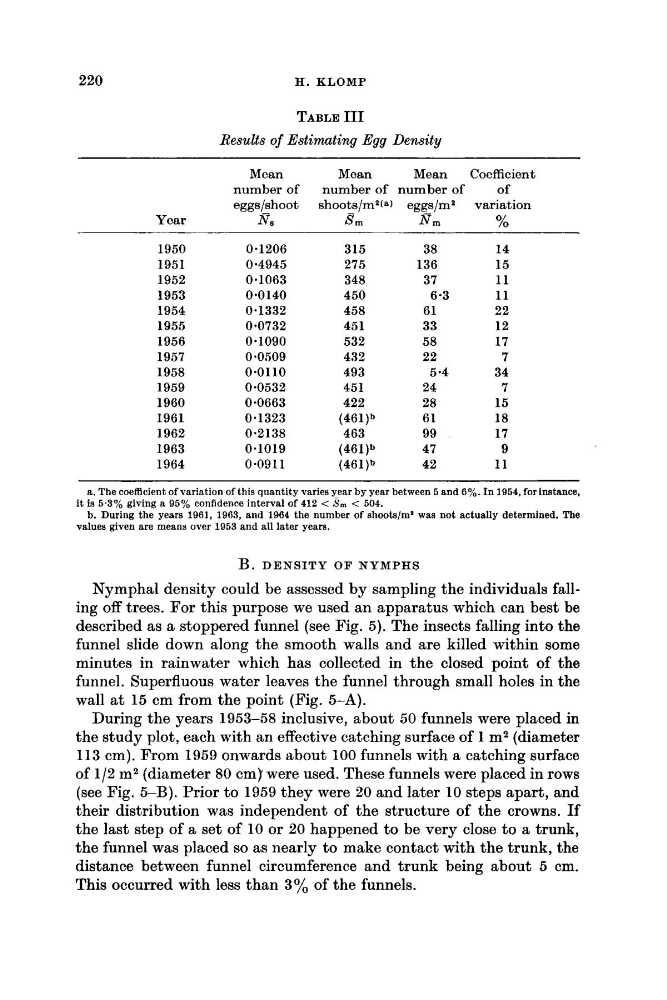
TABLE I11
Results of Estimating Egg Density
Mean
Mean
Mean
Coefficient
number of
number of number of
of
eggs/shoot shoots/m2(a) egg_s/m2 variation
Year
fl*
8 m
N m
%
1950
1951
1952
1953
1954
1955
1956
1957
1958
1959
1960
1961
1962
1963
1964
0.1206
0.4945
0.1063
0.0140
0.1332
0.0732
0.1090
0.0509
0*0110
0.0532
0.0663
0.1323
0.2138
0.1019
0.0911
315
275
348
450
458
45 1
532
432
493
451
422
(461)b
463
(461)b
(461)b
38
136
37
61
33
58
22
24
28
61
99
47
42
6.3
5 -4
14
15
11
11
22
12
17
7
34
7
15
18
17
9
11
a. The coefficient of variation of this quantity varies year by year between 5 and 6%. In 1954, for instance,
b. During the years 1961, 1963, and 1964 the number of shootslm' was not actually determined. The
it is 5.3% giving a 95% confldence interval of 412 < Sm < 504.
values given are means over 1953 and all later years.
B. DENSITY OF NYMPHS
Nymphal density could be assessed by sampling the individuals falling off trees. For this purpose we used an apparatus which can best be
described as a stoppered funnel (see Fig. 5 ) . The insects falling into the
funnel slide down along the smooth walls and are killed within some
minutes in rainwater which has collected in the closed point of the
funnel. Superfluous water leaves the funnel through small holes in the
wall a t 15 cm from the point (Fig. 5-A).
During the years 1953-58 inclusive, about 50 funnels were placed in
the study plot, each with an effective catching surface of 1 m2 (diameter
113 cm). From 1959 onwards about 100 funnels with a catching surface
of 1/2 m2 (diameter 80 cmj were used. These funnels were placed in rows
(see Fig. 5-B). Prior to 1959 they were 20 and later 10 steps apart, and
their distribution was independent of the structure of the crowns. If
the last step of a set of 10 or 20 happened to be very close to a trunk,
the funnel was placed so as nearly to make contact with the trunk, the
distance between funnel circumference and trunk being about 5 cm.
This occurred with less than 3% of the funnels.
H. KLOMP
TABLE I11
Results of Estimating Egg Density
Mean
Mean
Mean
Coefficient
number of
number of number of
of
eggs/shoot shoots/m2(a) egg_s/m2 variation
Year
fl*
8 m
N m
%
1950
1951
1952
1953
1954
1955
1956
1957
1958
1959
1960
1961
1962
1963
1964
0.1206
0.4945
0.1063
0.0140
0.1332
0.0732
0.1090
0.0509
0*0110
0.0532
0.0663
0.1323
0.2138
0.1019
0.0911
315
275
348
450
458
45 1
532
432
493
451
422
(461)b
463
(461)b
(461)b
38
136
37
61
33
58
22
24
28
61
99
47
42
6.3
5 -4
14
15
11
11
22
12
17
7
34
7
15
18
17
9
11
a. The coefficient of variation of this quantity varies year by year between 5 and 6%. In 1954, for instance,
b. During the years 1961, 1963, and 1964 the number of shootslm' was not actually determined. The
it is 5.3% giving a 95% confldence interval of 412 < Sm < 504.
values given are means over 1953 and all later years.
B. DENSITY OF NYMPHS
Nymphal density could be assessed by sampling the individuals falling off trees. For this purpose we used an apparatus which can best be
described as a stoppered funnel (see Fig. 5 ) . The insects falling into the
funnel slide down along the smooth walls and are killed within some
minutes in rainwater which has collected in the closed point of the
funnel. Superfluous water leaves the funnel through small holes in the
wall a t 15 cm from the point (Fig. 5-A).
During the years 1953-58 inclusive, about 50 funnels were placed in
the study plot, each with an effective catching surface of 1 m2 (diameter
113 cm). From 1959 onwards about 100 funnels with a catching surface
of 1/2 m2 (diameter 80 cmj were used. These funnels were placed in rows
(see Fig. 5-B). Prior to 1959 they were 20 and later 10 steps apart, and
their distribution was independent of the structure of the crowns. If
the last step of a set of 10 or 20 happened to be very close to a trunk,
the funnel was placed so as nearly to make contact with the trunk, the
distance between funnel circumference and trunk being about 5 cm.
This occurred with less than 3% of the funnels.