

DYNAMICS O F FIELD POPULATION O F P I N E LOOPER
221
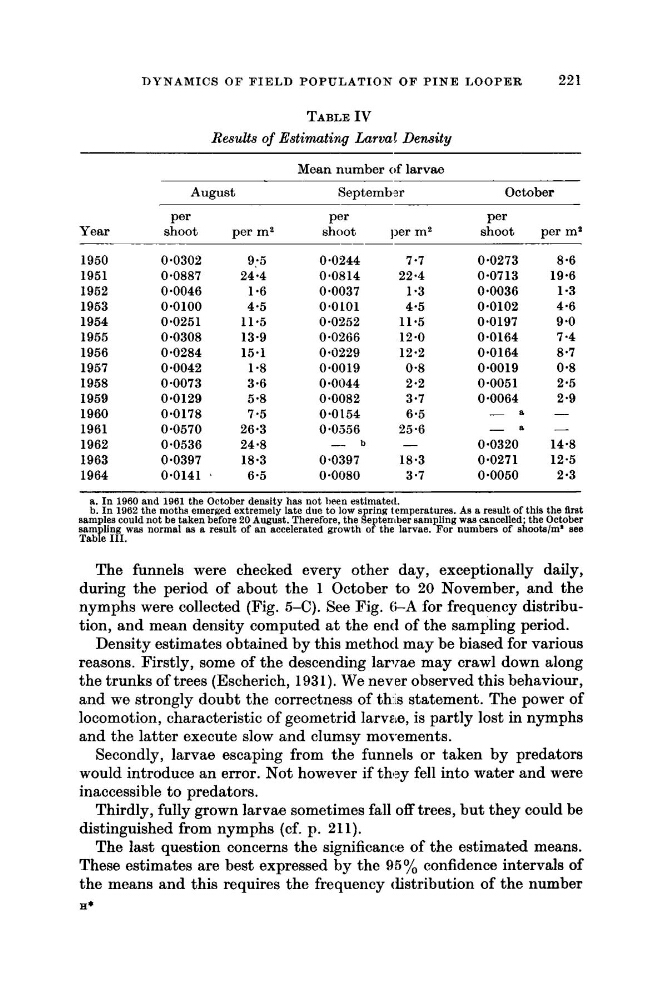
TABLE IV
Results of Estimating Larval Density
Mean number of larvae
August
Septemb,sr
October
Per
Per
Per
Year
shoot
per me
shoot
per me
shoot
per ma
1950
0.0302
9:5
0.0244
7 -7
0.0273
8 -6
1951
0.0887
24.4
0,0814
22.4
0.0713
19.6
1952
0.0046
1-6
0.0037
1 *3
0.0036
1 -3
1953
0~0100
4.5
0.0101
4.5
0.0102
4.6
1954
0.0251
11.5
0.0252
11.5
0.0197
9 -0
1955
0.0308
13.9
0.0266
12.0
0.0164
7 -4
1956
0.0284
15.1
0.0229
12-2
0.0164
8.7
1957
0.0042
1.8
0.0019
0.8
0.0019
0.8
1958
0.0073
3-6
0.0044
2 -2
0.0051
2.5
1959
0.0129
5 -8
0.0082
3.7
0.0064
2.9
1960
0.0178
7.5
0.0154
6.5
1961
0.0570
26.3
0.0556
25.6
1962
0.0536
24.8
- b
-
0.0320
14.8
1963
0.0397
18.3
0.0397
18.3
0-0271
12.5
1964
0.0141
6.5
0.0080
3 -7
0.0050
2 -3
-
a
-
-
a
-
a. In 1960 and 1961 the October density has not heen estimated.
b. In 1962 the moths emerged extremely late due to low spring temperatures. As a result of this the Brst
samples could not be taken before 20 August. Therefore, the September sampling was cancelled; the October
Sam ling was normal as a result of an accelerated growth of the larvae. For numbers of shootslm' see
Tabfe 111.
The funnels were checked every other day, exceptionally daily,
during the period of about the 1 October to 20 November, and the
nymphs were collected (Fig. 5-C). See Fig. G-A for frequency distribution, and mean density computed at the end of the sampling period.
Density estimates obtained by this method may be biased for various
reasons. Firstly, some of the descending larvae may crawl down along
the trunks of trees (Escherich, 1931). We never observed this behaviour,
and we strongly doubt the correctness of this statement. The power of
locomotion, characteristic of geometrid larvae, is partly lost in nymphs
and the latter execute slow and clumsy mol-ements.
Secondly, larvae escaping from the funnels or taken by predators
would introduce an error. Not however if they fell into water and were
inaccessible to predators.
Thirdly, fully grown larvae sometimes fall off trees, but they could be
distinguished from nymphs (cf. p. 211).
The last question concerns the significance of the estimated means.
These estimates are best expressed by the 95% confidence intervals of
the means and this requires the frequency distribution of the number
E*
221
TABLE IV
Results of Estimating Larval Density
Mean number of larvae
August
Septemb,sr
October
Per
Per
Per
Year
shoot
per me
shoot
per me
shoot
per ma
1950
0.0302
9:5
0.0244
7 -7
0.0273
8 -6
1951
0.0887
24.4
0,0814
22.4
0.0713
19.6
1952
0.0046
1-6
0.0037
1 *3
0.0036
1 -3
1953
0~0100
4.5
0.0101
4.5
0.0102
4.6
1954
0.0251
11.5
0.0252
11.5
0.0197
9 -0
1955
0.0308
13.9
0.0266
12.0
0.0164
7 -4
1956
0.0284
15.1
0.0229
12-2
0.0164
8.7
1957
0.0042
1.8
0.0019
0.8
0.0019
0.8
1958
0.0073
3-6
0.0044
2 -2
0.0051
2.5
1959
0.0129
5 -8
0.0082
3.7
0.0064
2.9
1960
0.0178
7.5
0.0154
6.5
1961
0.0570
26.3
0.0556
25.6
1962
0.0536
24.8
- b
-
0.0320
14.8
1963
0.0397
18.3
0.0397
18.3
0-0271
12.5
1964
0.0141
6.5
0.0080
3 -7
0.0050
2 -3
-
a
-
-
a
-
a. In 1960 and 1961 the October density has not heen estimated.
b. In 1962 the moths emerged extremely late due to low spring temperatures. As a result of this the Brst
samples could not be taken before 20 August. Therefore, the September sampling was cancelled; the October
Sam ling was normal as a result of an accelerated growth of the larvae. For numbers of shootslm' see
Tabfe 111.
The funnels were checked every other day, exceptionally daily,
during the period of about the 1 October to 20 November, and the
nymphs were collected (Fig. 5-C). See Fig. G-A for frequency distribution, and mean density computed at the end of the sampling period.
Density estimates obtained by this method may be biased for various
reasons. Firstly, some of the descending larvae may crawl down along
the trunks of trees (Escherich, 1931). We never observed this behaviour,
and we strongly doubt the correctness of this statement. The power of
locomotion, characteristic of geometrid larvae, is partly lost in nymphs
and the latter execute slow and clumsy mol-ements.
Secondly, larvae escaping from the funnels or taken by predators
would introduce an error. Not however if they fell into water and were
inaccessible to predators.
Thirdly, fully grown larvae sometimes fall off trees, but they could be
distinguished from nymphs (cf. p. 211).
The last question concerns the significance of the estimated means.
These estimates are best expressed by the 95% confidence intervals of
the means and this requires the frequency distribution of the number
E*