

DYNAMIOS OF FIELD POPULATION OF P I N E LOOPER
219
31
1
1217
836
372
0.445
32
1
1617
1649
893
0-677
2
1217
738
684
0.791
2
1617
1197
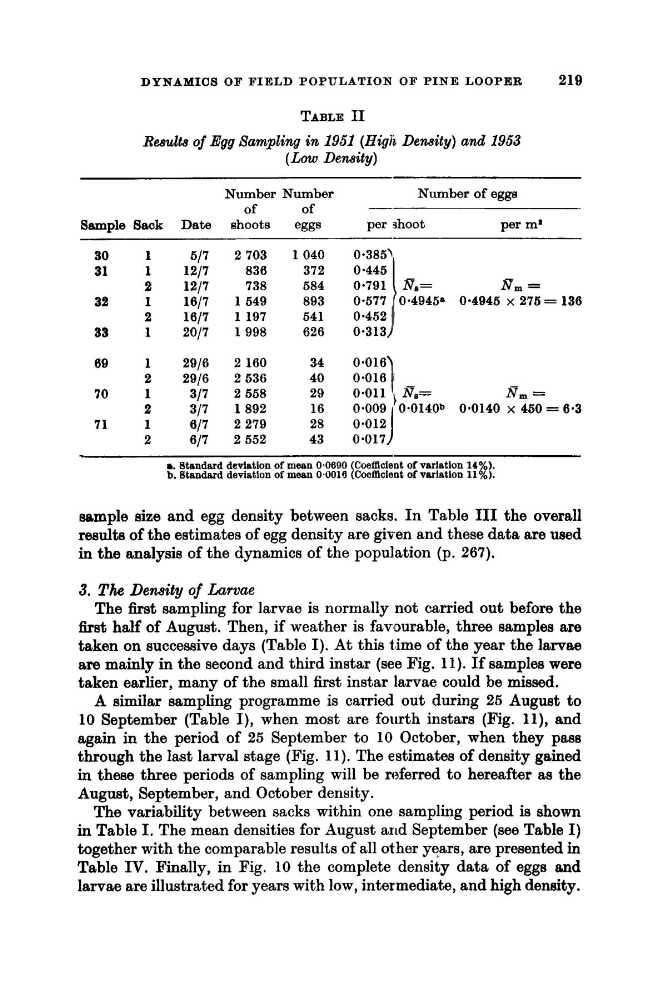
TABLE I1
Reeults of Egg 8ampling in 1951 (High Density) and 1953
( L m Density)
Number Number
Number of eggs
of
of
Sample Sack Date shoots
eggs
per 3hoot
per mr
~
Re=
R , =
0.4946a 0.4946 x 276= 136
a. Standard deviation of mean 0.0690 (CoefBcient of variation 14F .
b. Standard devistlon of mean 0.0016 (Coemcient of variation 11 /, I.
sample size and egg density between sacks. In Table I11 the overall
results of the estimates of egg density are given and these data are used
in the analysis of the dynamics of the population (p. 267).
3. The Density of Larvae
The first sampling for larvae is normally not carried out before the
first half of August. Then, if weather is favourable, three samples me
taken on successive days (Table I). At this time of the year the larvae
are mainly in the second and third instar (see Fig. 11). If samples were
taken earlier, many of the small first instar larvae could be missed.
A similar sampling programme is carried out during 26 August to
10 September (Table I), when most are fourth instars (Fig. l l ) , and
again in the period of 25 September to 10 October, when they paas
through the last larval stage (Fig. 11). The estimates of density gained
in these three periods of sampling will be referred to hereafter as the
August, September, and October density.
The variability between sacks within one sampling period is shown
in Table I. The mean densities for August arid September (see Table I)
together with the comparable results of all other years, are presented in
Table IV. Finally, in Fig. 10 the complete density data of eggs and
larvae are illustrated for years with low, intermediate, and high density.
A
09
1
2916
2 160
34
0.016
2
2916
2636
70
1
317
2 668
71
1
017
2 279
28
0.012
2
617
2 662
43
0.017
2
317
1892
0.0140 x 460 = 6.3
219
31
1
1217
836
372
0.445
32
1
1617
1649
893
0-677
2
1217
738
684
0.791
2
1617
1197
TABLE I1
Reeults of Egg 8ampling in 1951 (High Density) and 1953
( L m Density)
Number Number
Number of eggs
of
of
Sample Sack Date shoots
eggs
per 3hoot
per mr
~
Re=
R , =
0.4946a 0.4946 x 276= 136
a. Standard deviation of mean 0.0690 (CoefBcient of variation 14F .
b. Standard devistlon of mean 0.0016 (Coemcient of variation 11 /, I.
sample size and egg density between sacks. In Table I11 the overall
results of the estimates of egg density are given and these data are used
in the analysis of the dynamics of the population (p. 267).
3. The Density of Larvae
The first sampling for larvae is normally not carried out before the
first half of August. Then, if weather is favourable, three samples me
taken on successive days (Table I). At this time of the year the larvae
are mainly in the second and third instar (see Fig. 11). If samples were
taken earlier, many of the small first instar larvae could be missed.
A similar sampling programme is carried out during 26 August to
10 September (Table I), when most are fourth instars (Fig. l l ) , and
again in the period of 25 September to 10 October, when they paas
through the last larval stage (Fig. 11). The estimates of density gained
in these three periods of sampling will be referred to hereafter as the
August, September, and October density.
The variability between sacks within one sampling period is shown
in Table I. The mean densities for August arid September (see Table I)
together with the comparable results of all other years, are presented in
Table IV. Finally, in Fig. 10 the complete density data of eggs and
larvae are illustrated for years with low, intermediate, and high density.
A
09
1
2916
2 160
34
0.016
2
2916
2636
70
1
317
2 668
71
1
017
2 279
28
0.012
2
617
2 662
43
0.017
2
317
1892
0.0140 x 460 = 6.3