

166
J . E. Q. RAYMONT
The rate of change of phytoplankton population may be expressed
therefore in terms of five ecological parameters : solar radiation, transparency of water, depth of mixed layer, temperature, and zooplankton
quantity.
Riley obtained average numerical values from seasonal field data
from Georges Bank. Over short periods of time approximate integration
was possible, assuming a constant mean value for the variable over that
period. A relative curve of seasonal change was obtained. By statistically
determining the best fit of the curve for all the phytoplankton cruise
data, the actual seasonal changes and the theoretical curve may be
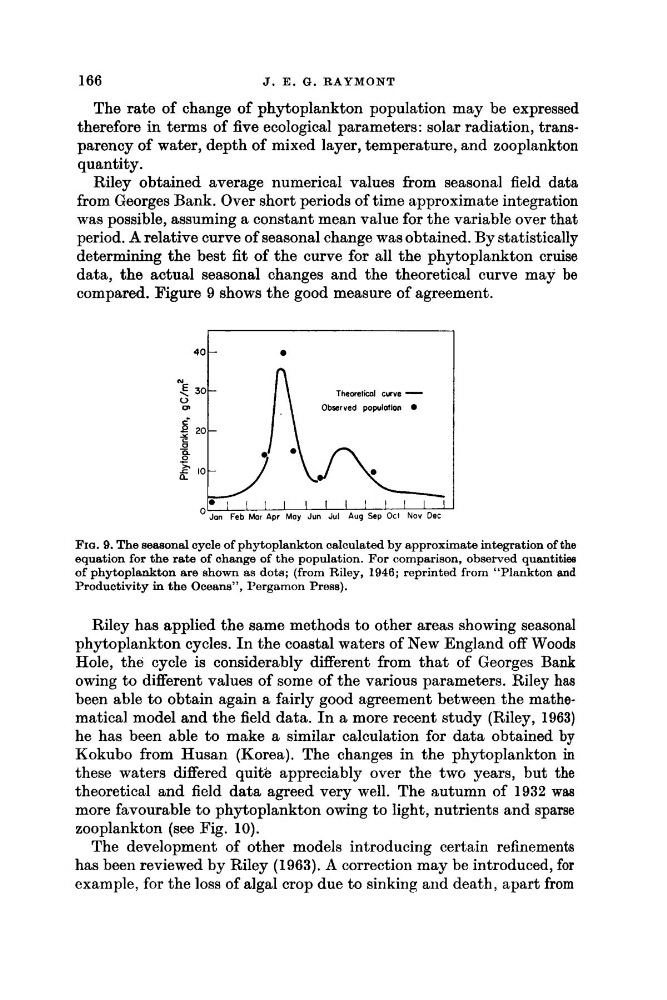
compared. Figure 9 shows the good measure of agreement.
FIQ. 9. The seaaonal cycle of phytoplankton calculated by approximate integration of the
equation for the rate of change of the population. For comparison, observed quatitias
of phytoplankton are shown as dots; (from Riley, 1946; reprinted from ‘‘Plankton and
Productivity in the Oceans”, Pergamon Press).
Riley has applied the same methods to other areas showing seasonal
phytoplankton cycles. In the coastal waters of New England off Woods
Hole, the cycle is considerably different from that of Georges Bank
owing to different values of some of the various parameters. Riley has
been able to obtain again a fairly good agreement between the mathematical model and the field data. In a more recent study (Riley, 1963)
he has been able to make a similar calculation for data obtained by
Kokubo from Husan (Korea). The changes in the phytoplankton in
these waters differed quire appreciably over the two years, but the
theoretical and field data agreed very well. The autumn of 1932 waa
more favourable to phytoplankton owing to light, nutrients and sparse
zooplankton (see Fig. 10).
The development of other models introducing certain refinements
has been reviewed by Riley (1963). A correction may be introduced, for
example, for the loss of algal crop due to sinking and death, apart from
J . E. Q. RAYMONT
The rate of change of phytoplankton population may be expressed
therefore in terms of five ecological parameters : solar radiation, transparency of water, depth of mixed layer, temperature, and zooplankton
quantity.
Riley obtained average numerical values from seasonal field data
from Georges Bank. Over short periods of time approximate integration
was possible, assuming a constant mean value for the variable over that
period. A relative curve of seasonal change was obtained. By statistically
determining the best fit of the curve for all the phytoplankton cruise
data, the actual seasonal changes and the theoretical curve may be
compared. Figure 9 shows the good measure of agreement.
FIQ. 9. The seaaonal cycle of phytoplankton calculated by approximate integration of the
equation for the rate of change of the population. For comparison, observed quatitias
of phytoplankton are shown as dots; (from Riley, 1946; reprinted from ‘‘Plankton and
Productivity in the Oceans”, Pergamon Press).
Riley has applied the same methods to other areas showing seasonal
phytoplankton cycles. In the coastal waters of New England off Woods
Hole, the cycle is considerably different from that of Georges Bank
owing to different values of some of the various parameters. Riley has
been able to obtain again a fairly good agreement between the mathematical model and the field data. In a more recent study (Riley, 1963)
he has been able to make a similar calculation for data obtained by
Kokubo from Husan (Korea). The changes in the phytoplankton in
these waters differed quire appreciably over the two years, but the
theoretical and field data agreed very well. The autumn of 1932 waa
more favourable to phytoplankton owing to light, nutrients and sparse
zooplankton (see Fig. 10).
The development of other models introducing certain refinements
has been reviewed by Riley (1963). A correction may be introduced, for
example, for the loss of algal crop due to sinking and death, apart from