

164
J . E . G . R A Y M O N T
the onset of the negative correlation depended on the month when the
zooplankton species reached its seasonal peak. Riley and Bumpus conclude that while the early correlation is due to some beneficial factor
such as increasing temperature, common to both phytoplankton and
zooplankton, the sharp change to an inverse relationship in May is due
to the grazing activity of the zooplankton. The authors have also calculated that while the percentage of the phytoplankton production
consumed by the zooplankton is relatively small (less than 10%) until
April, it rises sharply in May to over 40%.
Riley (1946, 1963) has developed a mathematical model somewhat
similar to that proposed by Fleming for the rate of increase in a phytoplankton population. He believed that SO-SO% of the phytoplankton
variations on Georges Bank (Gulf of Maine) could be accounted for in
terms of depth and illumination, temperature, nutrients (phosphate
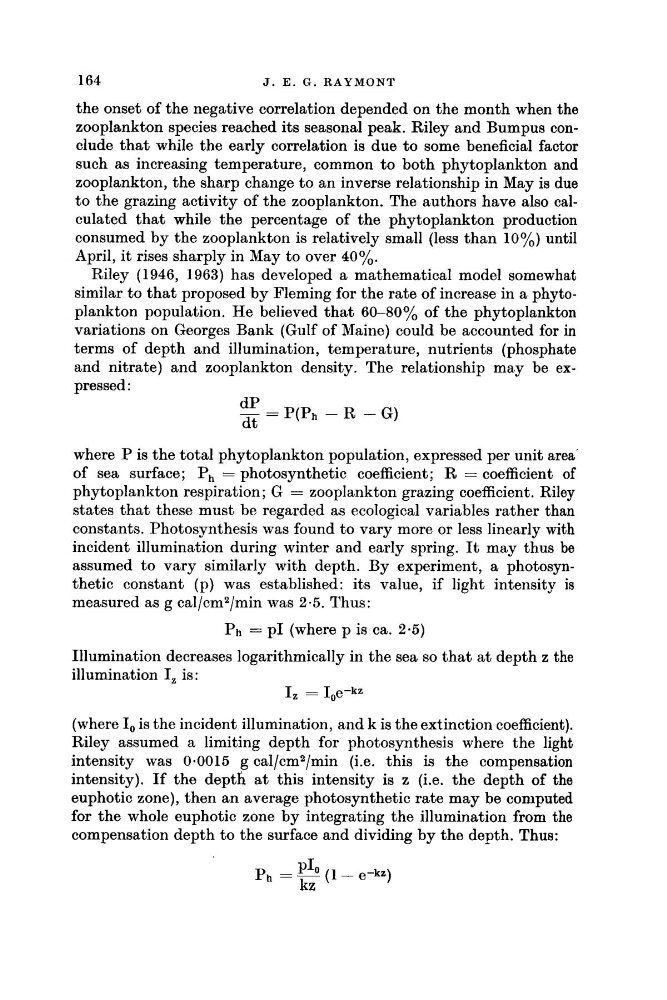
and nitrate) and zooplankton density. The relationship may be expressed :
- = P(Ph - R - G )
d P
dt
where P is the total phytoplankton population, expressed per unit area’
of sea surface; P h = photosynthetic coefficient; R = coefficient of
phytoplankton respiration ; G = zooplankton grazing coefficient. Riley
states that these must be regarded as ecological variables rather than
constants. Photosynthesis was found to vary more or less linearly with
incident illumination during winter and early spring. It may thus be
assumed to vary similarly with depth. By experiment, a photosynthetic constant (p) was established: its value, if light intensity is
measured as g cal/cm2/min was 2.5. Thus:
P h = PI (where p is ca. 2.5)
Illumination decreases logarithmically in the sea so that at depth z the
illumination I, is:
I, = I,e-kz
(where I, is the incident illumination, and k is the extinction coefficient).
Riley assumed a limiting depth for photosynthesis where the light
intensity was 0.0015 g cal/cm2/min (i.e. this is the compensation
intensity). If the depth a t this intensity is z (i.e. the depth of the
euphotic zone), then an average photosynthetic rate may be computed
for the whole euphotic zone by integrating the illumination from the
compensation depth to the surface and dividing by the depth. Thus:
J . E . G . R A Y M O N T
the onset of the negative correlation depended on the month when the
zooplankton species reached its seasonal peak. Riley and Bumpus conclude that while the early correlation is due to some beneficial factor
such as increasing temperature, common to both phytoplankton and
zooplankton, the sharp change to an inverse relationship in May is due
to the grazing activity of the zooplankton. The authors have also calculated that while the percentage of the phytoplankton production
consumed by the zooplankton is relatively small (less than 10%) until
April, it rises sharply in May to over 40%.
Riley (1946, 1963) has developed a mathematical model somewhat
similar to that proposed by Fleming for the rate of increase in a phytoplankton population. He believed that SO-SO% of the phytoplankton
variations on Georges Bank (Gulf of Maine) could be accounted for in
terms of depth and illumination, temperature, nutrients (phosphate
and nitrate) and zooplankton density. The relationship may be expressed :
- = P(Ph - R - G )
d P
dt
where P is the total phytoplankton population, expressed per unit area’
of sea surface; P h = photosynthetic coefficient; R = coefficient of
phytoplankton respiration ; G = zooplankton grazing coefficient. Riley
states that these must be regarded as ecological variables rather than
constants. Photosynthesis was found to vary more or less linearly with
incident illumination during winter and early spring. It may thus be
assumed to vary similarly with depth. By experiment, a photosynthetic constant (p) was established: its value, if light intensity is
measured as g cal/cm2/min was 2.5. Thus:
P h = PI (where p is ca. 2.5)
Illumination decreases logarithmically in the sea so that at depth z the
illumination I, is:
I, = I,e-kz
(where I, is the incident illumination, and k is the extinction coefficient).
Riley assumed a limiting depth for photosynthesis where the light
intensity was 0.0015 g cal/cm2/min (i.e. this is the compensation
intensity). If the depth a t this intensity is z (i.e. the depth of the
euphotic zone), then an average photosynthetic rate may be computed
for the whole euphotic zone by integrating the illumination from the
compensation depth to the surface and dividing by the depth. Thus: