

THE PRODUCTION O F MARINE PLANKTON
163
zooplankton coefficients suggested by Harvey, and obtained a symmetrical curve for the algal population change which agreed fairly well
with field observations. He also computed the total production of
algae, assuming a cell division rate of one division in 36 hours and that
this rate remained constant over the period iinder investigation. The
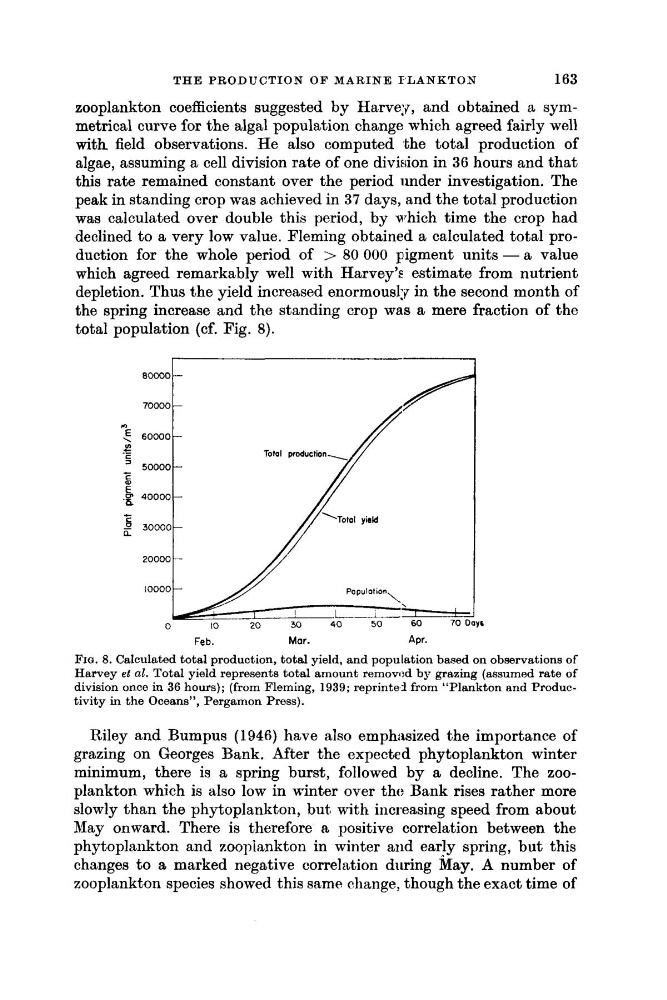
peak in standing crop was achieved in 37 days, and the total production
was calculated over double this period, by which time the crop had
declined to a very low value. Fleming obtained a calculated total production for the whole period of > 80 000 pigment units - a value
which agreed remarkably well with Harvey’E estimate from nutrient
depletion. Thus the yield increased enormously in the second month of
the spring increase and the standing crop was a mere fraction of the
total population (cf. Fig. 8).
Feb.
Mar.
Apr.
FIG. 8. Calculated total production, total yield, and population baaed on observations of
Harvey et al. Total yield represents total amount removod by grazing (assumed rate of
division once in 36 hours); (from Fleming, 1939; reprintel from “Plankton and Productivity in the Oceans”, Pergamon Press).
Riley and Bumpus (1946) have also emph:tsized the importance of
grazing on Georges Bank. After the expected phytoplankton winter
minimum, there is a spring burst, followed by a decline. The zooplankton which is also low in winter over tht: Bank rises rather more
slowly than the phytoplankton, but! with increasing speed from about
May onward. There is therefore 8 positive correlation between the
phytoplankton and zooplankton in winter and early spring, but this
changes to a marked negative correlation during May. A number of
zooplankton species showed this same change, though the exact time of
163
zooplankton coefficients suggested by Harvey, and obtained a symmetrical curve for the algal population change which agreed fairly well
with field observations. He also computed the total production of
algae, assuming a cell division rate of one division in 36 hours and that
this rate remained constant over the period iinder investigation. The
peak in standing crop was achieved in 37 days, and the total production
was calculated over double this period, by which time the crop had
declined to a very low value. Fleming obtained a calculated total production for the whole period of > 80 000 pigment units - a value
which agreed remarkably well with Harvey’E estimate from nutrient
depletion. Thus the yield increased enormously in the second month of
the spring increase and the standing crop was a mere fraction of the
total population (cf. Fig. 8).
Feb.
Mar.
Apr.
FIG. 8. Calculated total production, total yield, and population baaed on observations of
Harvey et al. Total yield represents total amount removod by grazing (assumed rate of
division once in 36 hours); (from Fleming, 1939; reprintel from “Plankton and Productivity in the Oceans”, Pergamon Press).
Riley and Bumpus (1946) have also emph:tsized the importance of
grazing on Georges Bank. After the expected phytoplankton winter
minimum, there is a spring burst, followed by a decline. The zooplankton which is also low in winter over tht: Bank rises rather more
slowly than the phytoplankton, but! with increasing speed from about
May onward. There is therefore 8 positive correlation between the
phytoplankton and zooplankton in winter and early spring, but this
changes to a marked negative correlation during May. A number of
zooplankton species showed this same change, though the exact time of