

176
ERNEST SCHOFFENIELS
of activity in the presence of monovalent cations over activity in the
absence of monovalent cation, for various concentrations of salts.
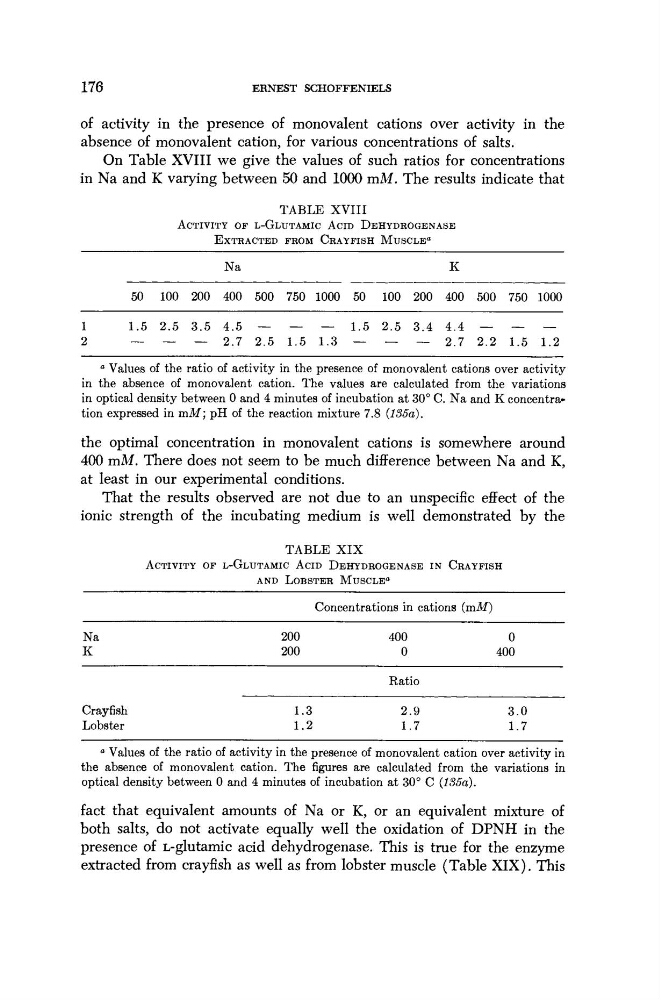
On Table XVIII we give the values of such ratios for concentrations
in Na and Κ varying between 50 and 1000 mM. The results indicate that
TABLE XVIII
ACTIVITY OF L-GLUTAMIC ACID DEHYDROGENASE
EXTRACTED FROM CRAYFISH MUSCLE"
Na
Κ
50 100 200 400 500 750 1000 50 100 200 400 500 750 1000
1
2
1.5 2.5 3.5 4.5
2.7 2.5 1.5
— 1.5
1.3 —
2.5 3.4 4.4
2.7 2.2 1.5 1.2
° Values of the ratio of activity in the presence of monovalent cations over activity
in the absence of monovalent cation. The values are calculated from the variations
in optical density between 0 and 4 minutes of incubation at 30° C. Na and Κ concentration expressed in ml; pH of the reaction mixture 7.8 {135a).
the optimal concentration in monovalent cations is somewhere around
400 mM. There does not seem to be much difference between Na and K,
at least in our experimental conditions.
That the results observed are not due to an unspecific effect of the
ionic strength of the incubating medium is well demonstrated by the
TABLE XIX
ACTIVITY OF L-GLUTAMIC ACID DEHYDROGENASE IN CRAYFISH
AND LOBSTER MUSCLE
0
Concentrations in cations (mM)
Na
200
400
0
Κ
200
0
400
Ratio
Crayfish
1. ,3
2.9
3.0
Lobster
1. ,2
1.7
1.7
a Values of the ratio of activity in the presence of monovalent cation over activity in
the absence of monovalent cation. The figures are calculated from the variations in
optical density between 0 and 4 minutes of incubation at 30° C (135a).
fact that equivalent amounts of Na or K, or an equivalent mixture of
both salts, do not activate equally well the oxidation of DPNH in the
presence of L-glutamic acid dehydrogenase. This is true for the enzyme
extracted from crayfish as well as from lobster muscle (Table XIX). This
ERNEST SCHOFFENIELS
of activity in the presence of monovalent cations over activity in the
absence of monovalent cation, for various concentrations of salts.
On Table XVIII we give the values of such ratios for concentrations
in Na and Κ varying between 50 and 1000 mM. The results indicate that
TABLE XVIII
ACTIVITY OF L-GLUTAMIC ACID DEHYDROGENASE
EXTRACTED FROM CRAYFISH MUSCLE"
Na
Κ
50 100 200 400 500 750 1000 50 100 200 400 500 750 1000
1
2
1.5 2.5 3.5 4.5
2.7 2.5 1.5
— 1.5
1.3 —
2.5 3.4 4.4
2.7 2.2 1.5 1.2
° Values of the ratio of activity in the presence of monovalent cations over activity
in the absence of monovalent cation. The values are calculated from the variations
in optical density between 0 and 4 minutes of incubation at 30° C. Na and Κ concentration expressed in ml; pH of the reaction mixture 7.8 {135a).
the optimal concentration in monovalent cations is somewhere around
400 mM. There does not seem to be much difference between Na and K,
at least in our experimental conditions.
That the results observed are not due to an unspecific effect of the
ionic strength of the incubating medium is well demonstrated by the
TABLE XIX
ACTIVITY OF L-GLUTAMIC ACID DEHYDROGENASE IN CRAYFISH
AND LOBSTER MUSCLE
0
Concentrations in cations (mM)
Na
200
400
0
Κ
200
0
400
Ratio
Crayfish
1. ,3
2.9
3.0
Lobster
1. ,2
1.7
1.7
a Values of the ratio of activity in the presence of monovalent cation over activity in
the absence of monovalent cation. The figures are calculated from the variations in
optical density between 0 and 4 minutes of incubation at 30° C (135a).
fact that equivalent amounts of Na or K, or an equivalent mixture of
both salts, do not activate equally well the oxidation of DPNH in the
presence of L-glutamic acid dehydrogenase. This is true for the enzyme
extracted from crayfish as well as from lobster muscle (Table XIX). This