

254
KENNETH V. THIMANN AND GEORGE M. CURRY
Results such as those in Table I and Fig. 1 have led to the rather
wide adoption, for the Avena coleoptile, of the terms "first positive" and
'second positive" curvature, in line with the idea that the phototropic
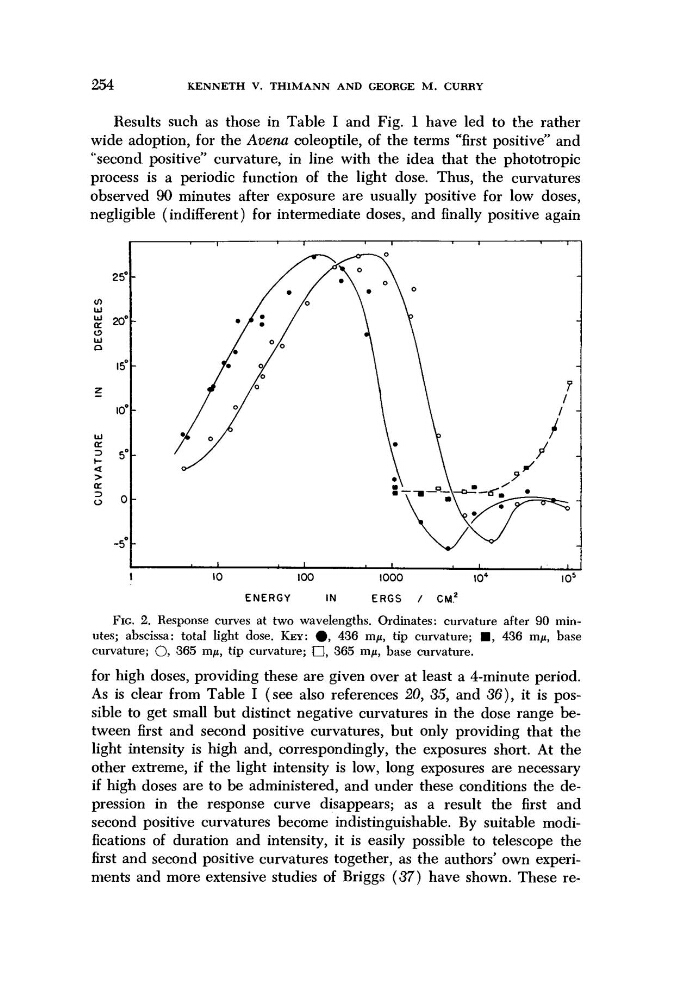
process is a periodic function of the light dose. Thus, the curvatures
observed 90 minutes after exposure are usually positive for low doses,
negligible (indifferent) for intermediate doses, and finally positive again
T
1
1
1
r
ENERGY
IN
ERGS
/
CM
2
FIG. 2. Response curves at two wavelengths. Ordinates: curvature after 90 minutes; abscissa: total light dose. KEY: #, 436 πΐμ, tip curvature; ■, 436 τημ, base
curvature; O, 365 m/ί, tip curvature; O, 365 ηΐμ, base curvature.
for high doses, providing these are given over at least a 4-minute period.
As is clear from Table I (see also references 20, 35, and 36), it is possible to get small but distinct negative curvatures in the dose range between first and second positive curvatures, but only providing that the
light intensity is high and, correspondingly, the exposures short. At the
other extreme, if the light intensity is low, long exposures are necessary
if high doses are to be administered, and under these conditions the depression in the response curve disappears; as a result the first and
second positive curvatures become indistinguishable. By suitable modifications of duration and intensity, it is easily possible to telescope the
first and second positive curvatures together, as the authors' own experiments and more extensive studies of Briggs (37) have shown. These re-
KENNETH V. THIMANN AND GEORGE M. CURRY
Results such as those in Table I and Fig. 1 have led to the rather
wide adoption, for the Avena coleoptile, of the terms "first positive" and
'second positive" curvature, in line with the idea that the phototropic
process is a periodic function of the light dose. Thus, the curvatures
observed 90 minutes after exposure are usually positive for low doses,
negligible (indifferent) for intermediate doses, and finally positive again
T
1
1
1
r
ENERGY
IN
ERGS
/
CM
2
FIG. 2. Response curves at two wavelengths. Ordinates: curvature after 90 minutes; abscissa: total light dose. KEY: #, 436 πΐμ, tip curvature; ■, 436 τημ, base
curvature; O, 365 m/ί, tip curvature; O, 365 ηΐμ, base curvature.
for high doses, providing these are given over at least a 4-minute period.
As is clear from Table I (see also references 20, 35, and 36), it is possible to get small but distinct negative curvatures in the dose range between first and second positive curvatures, but only providing that the
light intensity is high and, correspondingly, the exposures short. At the
other extreme, if the light intensity is low, long exposures are necessary
if high doses are to be administered, and under these conditions the depression in the response curve disappears; as a result the first and
second positive curvatures become indistinguishable. By suitable modifications of duration and intensity, it is easily possible to telescope the
first and second positive curvatures together, as the authors' own experiments and more extensive studies of Briggs (37) have shown. These re-