

6. PHOTOTROPISM AND PHOTOTAXIS
255
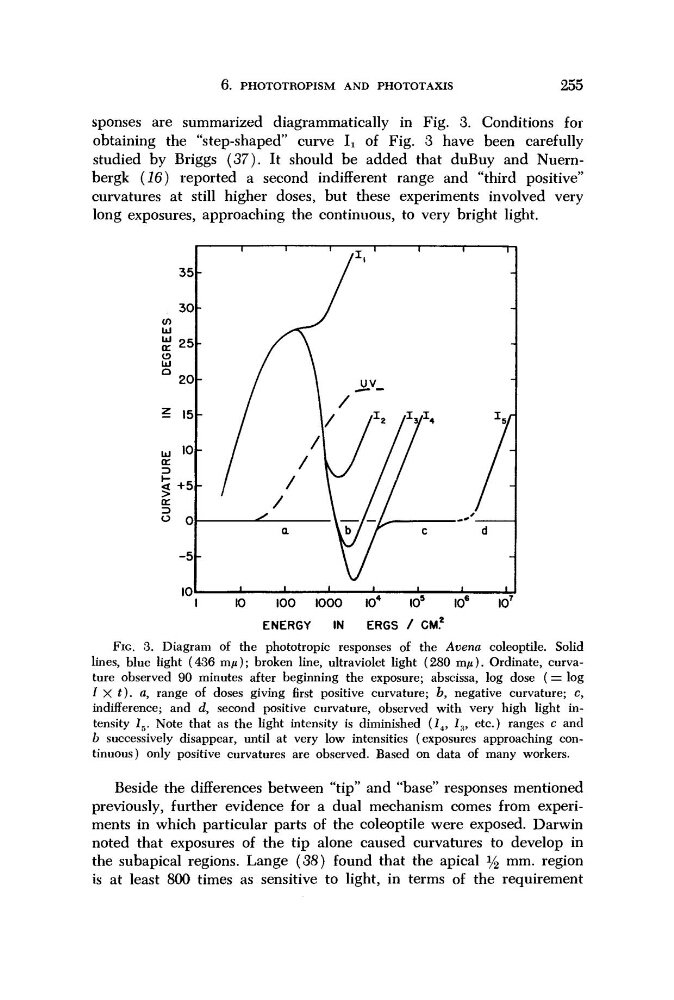
sponses are summarized diagrammatically in Fig. 3. Conditions for
obtaining the "step-shaped" curve Ii of Fig. 3 have been carefully
studied by Briggs (37). It should be added that duBuy and Nuernbergk (16) reported a second indifferent range and "third positive"
curvatures at still higher doses, but these experiments involved very
long exposures, approaching the continuous, to very bright light.
35
30
(Λ
UJ
£25
CD
UJ
°20
? 15
UJ 10
ξ + 5
>
ID
« o
-5
'~l
10
100
1000
I0
4
I0
5
I0
6
I0
7
ENERGY
IN
ERGS / CM.
2
FIG. 3. Diagram of the phototropic responses of the Avena coleoptile. Solid
lines, blue light (436 πΐμ); broken line, ultraviolet light (280 m/x). Ordinate, curvature observed 90 minutes after beginning the exposure; abscissa, log dose (= log
I X t). a, range of doses giving first positive curvature; b, negative curvature; c,
indifference; and d, second positive curvature, observed with very high light intensity I 5 . Note that as the light intensity is diminished (I 4 , I 3 , etc.) ranges c and
b successively disappear, until at very low intensities (exposures approaching continuous) only positive curvatures are observed. Based on data of many workers.
Beside the differences between "tip" and "base" responses mentioned
previously, further evidence for a dual mechanism comes from experiments in which particular parts of the coleoptile were exposed. Darwin
noted that exposures of the tip alone caused curvatures to develop in
the subapical regions. Lange (88) found that the apical y 2 mm. region
is at least 800 times as sensitive to light, in terms of the requirement
T
1
1
-
i
1
r
I
I
I
I
I
I
255
sponses are summarized diagrammatically in Fig. 3. Conditions for
obtaining the "step-shaped" curve Ii of Fig. 3 have been carefully
studied by Briggs (37). It should be added that duBuy and Nuernbergk (16) reported a second indifferent range and "third positive"
curvatures at still higher doses, but these experiments involved very
long exposures, approaching the continuous, to very bright light.
35
30
(Λ
UJ
£25
CD
UJ
°20
? 15
UJ 10
ξ + 5
>
ID
« o
-5
'~l
10
100
1000
I0
4
I0
5
I0
6
I0
7
ENERGY
IN
ERGS / CM.
2
FIG. 3. Diagram of the phototropic responses of the Avena coleoptile. Solid
lines, blue light (436 πΐμ); broken line, ultraviolet light (280 m/x). Ordinate, curvature observed 90 minutes after beginning the exposure; abscissa, log dose (= log
I X t). a, range of doses giving first positive curvature; b, negative curvature; c,
indifference; and d, second positive curvature, observed with very high light intensity I 5 . Note that as the light intensity is diminished (I 4 , I 3 , etc.) ranges c and
b successively disappear, until at very low intensities (exposures approaching continuous) only positive curvatures are observed. Based on data of many workers.
Beside the differences between "tip" and "base" responses mentioned
previously, further evidence for a dual mechanism comes from experiments in which particular parts of the coleoptile were exposed. Darwin
noted that exposures of the tip alone caused curvatures to develop in
the subapical regions. Lange (88) found that the apical y 2 mm. region
is at least 800 times as sensitive to light, in terms of the requirement
T
1
1
-
i
1
r
I
I
I
I
I
I