

6. PHOTOTROPISM AND PHOTOTAXIS
253
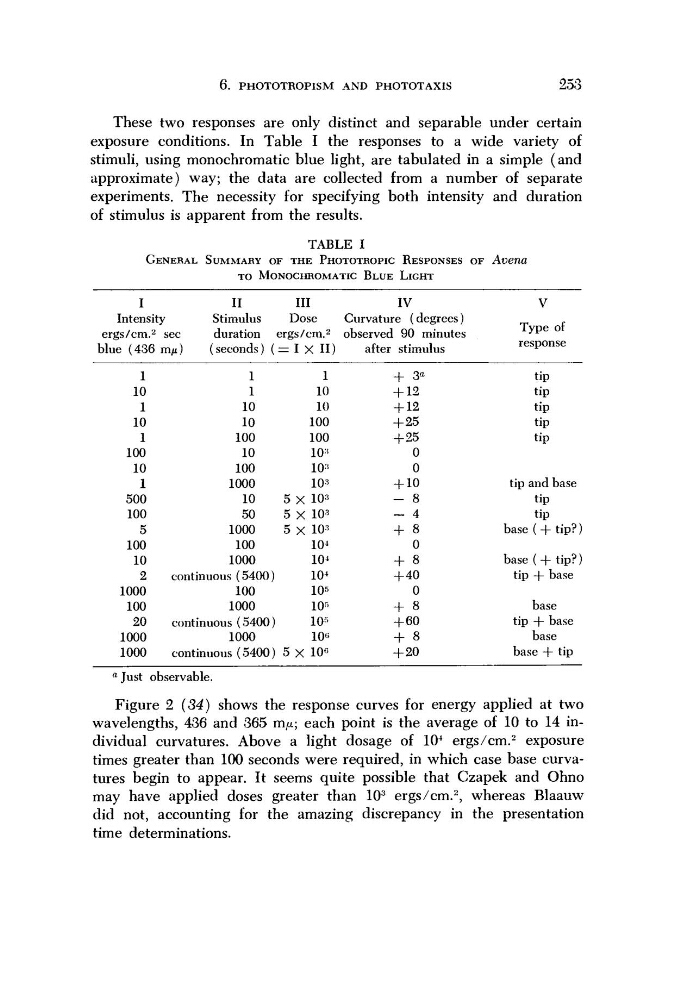
These two responses are only distinct and separable under certain
exposure conditions. In Table I the responses to a wide variety of
stimuli, using monochromatic blue light, are tabulated in a simple (and
approximate) way; the data are collected from a number of separate
experiments. The necessity for specifying both intensity and duration
of stimulus is apparent from the results.
TABLE I
GENERAL SUMMARY OF THE PHOTOTROPIC RESPONSES OF Avena
TO MONOCHROMATIC BLUE LIGHT
I
II
III
IV
V
Intensity
ergs/cm.
2
blue (436
1
10
1
10
1
100
10
1
500
100
5
100
10
2
1000
100
20
1000
1000
sec
γημ)
Stimulus
duration <
(seconds) (
1
1
10
10
100
10
100
1000
10
50
1000
100
1000
continuous (5400)
100
1000
continuous (5400)
1000
continuous (5400)
Dose
srgs/cm.
2
= 1 X Π)
1
10
10
100
100
10*
10
3
10
3
5 X 10³
5 X 10³
5 X 10³
10
4
104
10
4
105
10
5
10*
106
5 X 10⁶
Curvature (degrees)
observed 90 minutes
after stimulus
+ 3
a
+ 12
+ 12
+ 25
+25
0
0
+ 10
- 8
- 4
+ 8
0
+ 8
+40
0
+ 8
+ 60
+ 8
+20
Type of
response
tip
tip
tip
tip
tip
tip and base
tip
tip
base ( + tip?)
base ( + tip?)
tip -f base
base
tip + base
base
base + tip
α Just observable.
Figure 2 (34) shows the response curves for energy applied at two
wavelengths, 436 and 365 πΐμ; each point is the average of 10 to 14 individual curvatures. Above a light dosage of 10
4 ergs/cm.
2 exposure
times greater than 100 seconds were required, in which case base curvatures begin to appear. It seems quite possible that Czapek and Ohno
may have applied doses greater than 10
3 ergs/cm.
2 , whereas Blaauw
did not, accounting for the amazing discrepancy in the presentation
time determinations.
253
These two responses are only distinct and separable under certain
exposure conditions. In Table I the responses to a wide variety of
stimuli, using monochromatic blue light, are tabulated in a simple (and
approximate) way; the data are collected from a number of separate
experiments. The necessity for specifying both intensity and duration
of stimulus is apparent from the results.
TABLE I
GENERAL SUMMARY OF THE PHOTOTROPIC RESPONSES OF Avena
TO MONOCHROMATIC BLUE LIGHT
I
II
III
IV
V
Intensity
ergs/cm.
2
blue (436
1
10
1
10
1
100
10
1
500
100
5
100
10
2
1000
100
20
1000
1000
sec
γημ)
Stimulus
duration <
(seconds) (
1
1
10
10
100
10
100
1000
10
50
1000
100
1000
continuous (5400)
100
1000
continuous (5400)
1000
continuous (5400)
Dose
srgs/cm.
2
= 1 X Π)
1
10
10
100
100
10*
10
3
10
3
5 X 10³
5 X 10³
5 X 10³
10
4
104
10
4
105
10
5
10*
106
5 X 10⁶
Curvature (degrees)
observed 90 minutes
after stimulus
+ 3
a
+ 12
+ 12
+ 25
+25
0
0
+ 10
- 8
- 4
+ 8
0
+ 8
+40
0
+ 8
+ 60
+ 8
+20
Type of
response
tip
tip
tip
tip
tip
tip and base
tip
tip
base ( + tip?)
base ( + tip?)
tip -f base
base
tip + base
base
base + tip
α Just observable.
Figure 2 (34) shows the response curves for energy applied at two
wavelengths, 436 and 365 πΐμ; each point is the average of 10 to 14 individual curvatures. Above a light dosage of 10
4 ergs/cm.
2 exposure
times greater than 100 seconds were required, in which case base curvatures begin to appear. It seems quite possible that Czapek and Ohno
may have applied doses greater than 10
3 ergs/cm.
2 , whereas Blaauw
did not, accounting for the amazing discrepancy in the presentation
time determinations.