

262
L A U R I S A X E N E T A L .
FIG. 7. Series of micrographs demonstrating different stages of tubule formation
in transfilter experiments. (From Wartiovaara, 1966b.)
A . Response at the Level of Ribonucleic A c i d Synthesis
The actinomycin D sensitivity of the differentiation in this system was
tested in order to discover whether the inductive stimulus led to activation of genetic material (Goldberg et al., 1962; Hurwitz et al., 1962).
The results indicate that a sensitive period does exist up to 2 0 - 2 4 hours
o
2
A
6
8
DAYS OF CULTIVATION
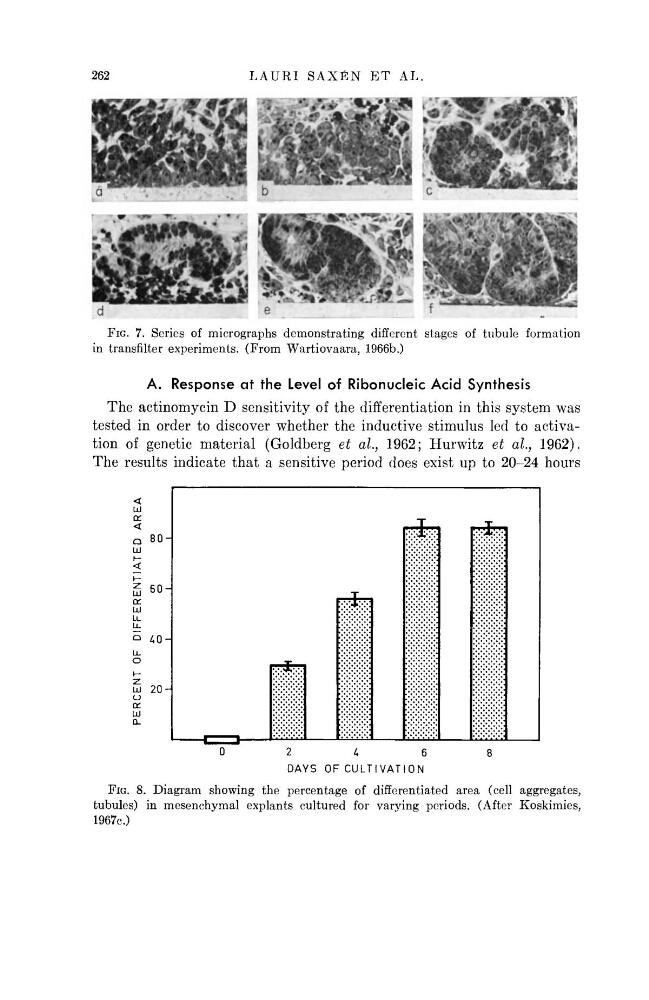
FIG. 8. Diagram showing the percentage of differentiated area (cell aggregates,
tubules) in mesenchymal explants cultured for varying periods. (After Koskimies,
1967c.)
PERCENT OF DIFFERENTIATED AREA
L A U R I S A X E N E T A L .
FIG. 7. Series of micrographs demonstrating different stages of tubule formation
in transfilter experiments. (From Wartiovaara, 1966b.)
A . Response at the Level of Ribonucleic A c i d Synthesis
The actinomycin D sensitivity of the differentiation in this system was
tested in order to discover whether the inductive stimulus led to activation of genetic material (Goldberg et al., 1962; Hurwitz et al., 1962).
The results indicate that a sensitive period does exist up to 2 0 - 2 4 hours
o
2
A
6
8
DAYS OF CULTIVATION
FIG. 8. Diagram showing the percentage of differentiated area (cell aggregates,
tubules) in mesenchymal explants cultured for varying periods. (After Koskimies,
1967c.)
PERCENT OF DIFFERENTIATED AREA