

220
SILVIO RANZI
1.0-,
E
0 ^
0.6-1
0.4 H
°^o
*
0 ^.
·····
0.2-1 "·..·. ■ · · .
.
βΊ ' I
oHK
*
ΔΔ
·Α-| hAH
h
mgN
k 9 0
h 60
-90
H μ-Η l·
ΓΑΤΊ—ΠΊ
ΓΊ
ΓΠ
1
1
1
1
1—ι Γ~p
H
U|5/ 6 9 12 14 16 18 19 20 21
22
25 A
1 8 10 13 15
k h r - M — M i l l
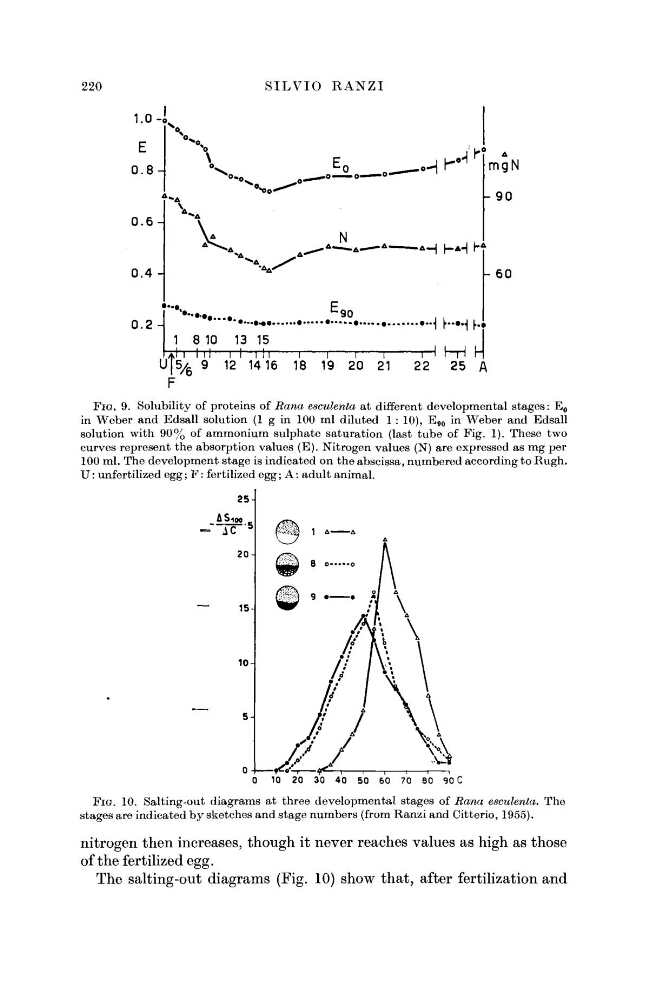
FIG. 9. Solubility of proteins of Rana esculenta at different developmental stages: E 0
in Weber and Edsall solution (1 g in 100 ml diluted 1 : 10), E 90 in Weber and Edsall
solution with 90% of ammonium sulphate saturation (last tube of Fig. 1). These two
curves represent the absorption values (E). Nitrogen values (N) are expressed as mg per
100 ml. The development stage is indicated on the abscissa, numbered according to Rugh.
U : unfertilized egg; F : fertilized egg; A: adult animal.
- AC
10 20 30 40 50 60 70 80 90 C
FIG. 10. Salting-out diagrams at three developmental stages of Rana esculenta. The
stages are indicated by sketches and stage numbers (from Ranzi and Citterio, 1955).
nitrogen then increases, though it never reaches values as high as those
of the fertilized egg.
The salting-out diagrams (Fig. 10) show that, after fertilization and
SILVIO RANZI
1.0-,
E
0 ^
0.6-1
0.4 H
°^o
*
0 ^.
·····
0.2-1 "·..·. ■ · · .
.
βΊ ' I
oHK
*
ΔΔ
·Α-| hAH
h
mgN
k 9 0
h 60
-90
H μ-Η l·
ΓΑΤΊ—ΠΊ
ΓΊ
ΓΠ
1
1
1
1
1—ι Γ~p
H
U|5/ 6 9 12 14 16 18 19 20 21
22
25 A
1 8 10 13 15
k h r - M — M i l l
FIG. 9. Solubility of proteins of Rana esculenta at different developmental stages: E 0
in Weber and Edsall solution (1 g in 100 ml diluted 1 : 10), E 90 in Weber and Edsall
solution with 90% of ammonium sulphate saturation (last tube of Fig. 1). These two
curves represent the absorption values (E). Nitrogen values (N) are expressed as mg per
100 ml. The development stage is indicated on the abscissa, numbered according to Rugh.
U : unfertilized egg; F : fertilized egg; A: adult animal.
- AC
10 20 30 40 50 60 70 80 90 C
FIG. 10. Salting-out diagrams at three developmental stages of Rana esculenta. The
stages are indicated by sketches and stage numbers (from Ranzi and Citterio, 1955).
nitrogen then increases, though it never reaches values as high as those
of the fertilized egg.
The salting-out diagrams (Fig. 10) show that, after fertilization and