

216
SILVIO RANZI
The salting-in diagrams were obtained simply by diluting the protein
solution with water: the first test tube contained 1 ml of the protein
solution (in unbuffered 1 M-KC1) and 9 ml of the solvent; the second
contained 1 ml of the protein solution, 8-5 ml of the solvent, and 0-5 ml
— i
20 30 40 50 60 70 80 90 C
t
t t
t
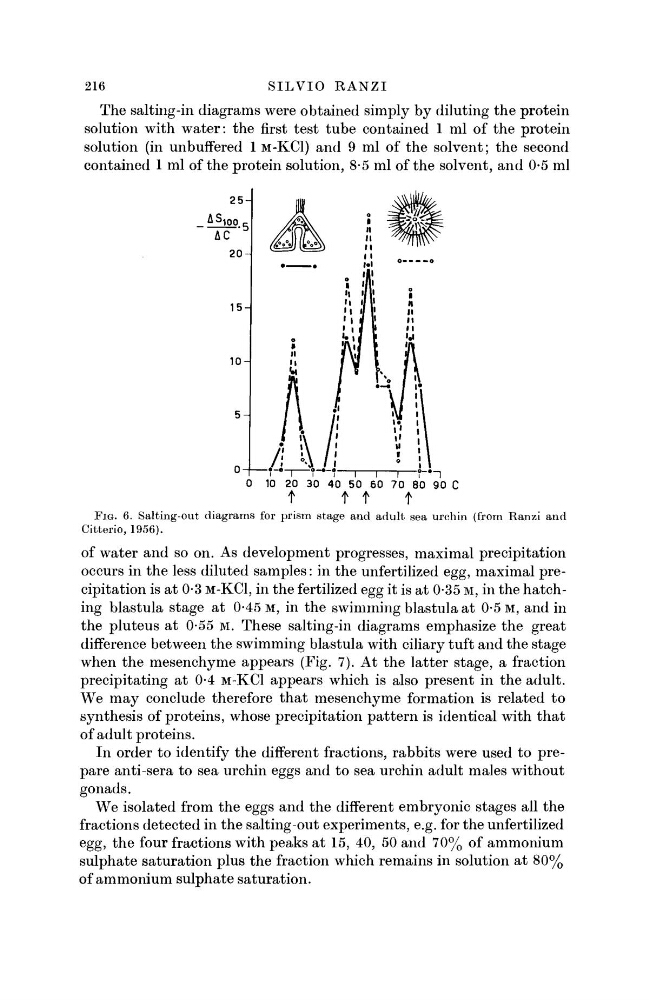
FIG. 6. Salting-out diagrams for prism stage and adult sea urchin (from Ranzi and
Citterio, 1956).
of water and so on. As development progresses, maximal precipitation
occurs in the less diluted samples: in the unfertilized egg, maximal precipitation is at 0-3 M-KCI, in the fertilized egg it is at 0-35 M, in the hatching blastula stage at 0-45 M, in the swimming blastula at 0-5 M, and in
the pluteus at 0-55 M. These salting-in diagrams emphasize the great
difference between the swimming blastula with ciliary tuft and the stage
when the mesenchyme appears (Fig. 7). At the latter stage, a fraction
precipitating at 0-4 M - K C I appears which is also present in the adult.
We may conclude therefore that mesenchyme formation is related to
synthesis of proteins, whose precipitation pattern is identical with that
of adult proteins.
In order to identify the different fractions, rabbits were used to prepare anti-sera to sea urchin eggs and to sea urchin adult males without
gonads.
We isolated from the eggs and the different embryonic stages all the
fractions detected in the salting-out experiments, e.g. for the unfertilized
egg, the four fractions with peaks at 15, 40, 50 and 70% of ammonium
sulphate saturation plus the fraction which remains in solution at 80%
of ammonium sulphate saturation.
SILVIO RANZI
The salting-in diagrams were obtained simply by diluting the protein
solution with water: the first test tube contained 1 ml of the protein
solution (in unbuffered 1 M-KC1) and 9 ml of the solvent; the second
contained 1 ml of the protein solution, 8-5 ml of the solvent, and 0-5 ml
— i
20 30 40 50 60 70 80 90 C
t
t t
t
FIG. 6. Salting-out diagrams for prism stage and adult sea urchin (from Ranzi and
Citterio, 1956).
of water and so on. As development progresses, maximal precipitation
occurs in the less diluted samples: in the unfertilized egg, maximal precipitation is at 0-3 M-KCI, in the fertilized egg it is at 0-35 M, in the hatching blastula stage at 0-45 M, in the swimming blastula at 0-5 M, and in
the pluteus at 0-55 M. These salting-in diagrams emphasize the great
difference between the swimming blastula with ciliary tuft and the stage
when the mesenchyme appears (Fig. 7). At the latter stage, a fraction
precipitating at 0-4 M - K C I appears which is also present in the adult.
We may conclude therefore that mesenchyme formation is related to
synthesis of proteins, whose precipitation pattern is identical with that
of adult proteins.
In order to identify the different fractions, rabbits were used to prepare anti-sera to sea urchin eggs and to sea urchin adult males without
gonads.
We isolated from the eggs and the different embryonic stages all the
fractions detected in the salting-out experiments, e.g. for the unfertilized
egg, the four fractions with peaks at 15, 40, 50 and 70% of ammonium
sulphate saturation plus the fraction which remains in solution at 80%
of ammonium sulphate saturation.