

246
H. WALTER AND E. STADELMANN
The molecular basis of these protoplasmic changes is not yet known.
It is thought to involve such factors as water binding and SH groups of
proteins (cf. Parker, 1968, p. 223ff; Levitt, 1962; Parichia and Levitt,
1967). Recently, Tumanow (1967, p. 523/442) emphasized the transition of protoplasmic colloids from the gel to the sol state during frost
hardening, with accumulation of sugars in the water of the intermicellar
spaces (p. 529/446). However, this hypothesis does not account for
transport of sugar through the tonoplast into the vacuole.
Several phases can be distinguished during the decrease of osmotic
potential φ 8 (increase of ττ*) when the water supply becomes more and
more deficient (see Fig. 17):
Phase A: (good water supply) optimal value of the osmotic
potential ψ 8
Phase B: small decrease of ψ 8 , unimportant retardation of growth
Phase C: the osmotic potential decreases more rapidly; only small
increases in dry weight of the plant
Phase D: rapid decrease of ψ 8 , a critical stage is reached and no
further increase in dry weight occurs
Phase E: final phase before death of plant, the dry weight decreases
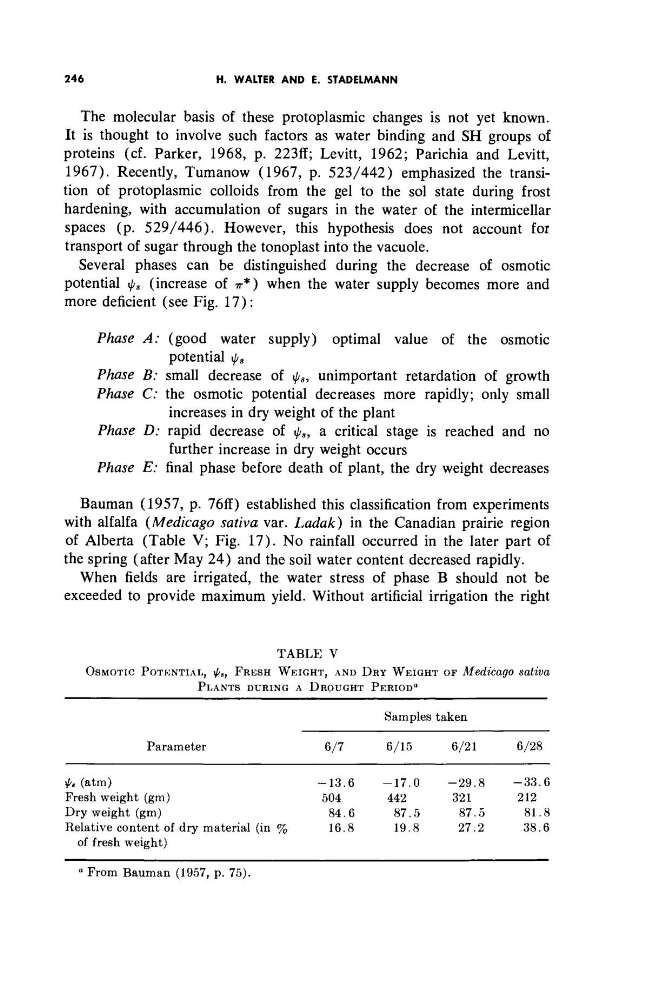
Bauman (1957, p. 76ff) established this classification from experiments
with alfalfa (Medicago sativa var. Ladak) in the Canadian prairie region
of Alberta (Table V; Fig. 17). No rainfall occurred in the later part of
the spring (after May 24) and the soil water content decreased rapidly.
When fields are irrigated, the water stress of phase B should not be
exceeded to provide maximum yield. Without artificial irrigation the right
TABLE V
OSMOTIC POTENTIAL, φ8, F R E S H W E I G H T , AND D R Y W E I G H T OF Medicago sativa
PLANTS DURING A DROUGHT PERIOD«
Samples taken
Parameter
6/7
6/15
6/21
6/28
i M a t m )
- 1 3 . 6
- 1 7 . 0
- 2 9 . 8 - 3 3 . 6
Fresh weight (gm)
504
442
321
212
Dry weight (gm)
8 4 . 6
8 7 . 5
8 7 . 5
8 1 . 8
Relative content of dry material (in %
16.8
19.8
2 7 . 2
3 8 . 6
of fresh weight)
° From Bauman (1957, p . 75).
H. WALTER AND E. STADELMANN
The molecular basis of these protoplasmic changes is not yet known.
It is thought to involve such factors as water binding and SH groups of
proteins (cf. Parker, 1968, p. 223ff; Levitt, 1962; Parichia and Levitt,
1967). Recently, Tumanow (1967, p. 523/442) emphasized the transition of protoplasmic colloids from the gel to the sol state during frost
hardening, with accumulation of sugars in the water of the intermicellar
spaces (p. 529/446). However, this hypothesis does not account for
transport of sugar through the tonoplast into the vacuole.
Several phases can be distinguished during the decrease of osmotic
potential φ 8 (increase of ττ*) when the water supply becomes more and
more deficient (see Fig. 17):
Phase A: (good water supply) optimal value of the osmotic
potential ψ 8
Phase B: small decrease of ψ 8 , unimportant retardation of growth
Phase C: the osmotic potential decreases more rapidly; only small
increases in dry weight of the plant
Phase D: rapid decrease of ψ 8 , a critical stage is reached and no
further increase in dry weight occurs
Phase E: final phase before death of plant, the dry weight decreases
Bauman (1957, p. 76ff) established this classification from experiments
with alfalfa (Medicago sativa var. Ladak) in the Canadian prairie region
of Alberta (Table V; Fig. 17). No rainfall occurred in the later part of
the spring (after May 24) and the soil water content decreased rapidly.
When fields are irrigated, the water stress of phase B should not be
exceeded to provide maximum yield. Without artificial irrigation the right
TABLE V
OSMOTIC POTENTIAL, φ8, F R E S H W E I G H T , AND D R Y W E I G H T OF Medicago sativa
PLANTS DURING A DROUGHT PERIOD«
Samples taken
Parameter
6/7
6/15
6/21
6/28
i M a t m )
- 1 3 . 6
- 1 7 . 0
- 2 9 . 8 - 3 3 . 6
Fresh weight (gm)
504
442
321
212
Dry weight (gm)
8 4 . 6
8 7 . 5
8 7 . 5
8 1 . 8
Relative content of dry material (in %
16.8
19.8
2 7 . 2
3 8 . 6
of fresh weight)
° From Bauman (1957, p . 75).