

AIR -SEA INTERACTIONS
40 1
5
4
3
2
1
0
I
0
2
1
0
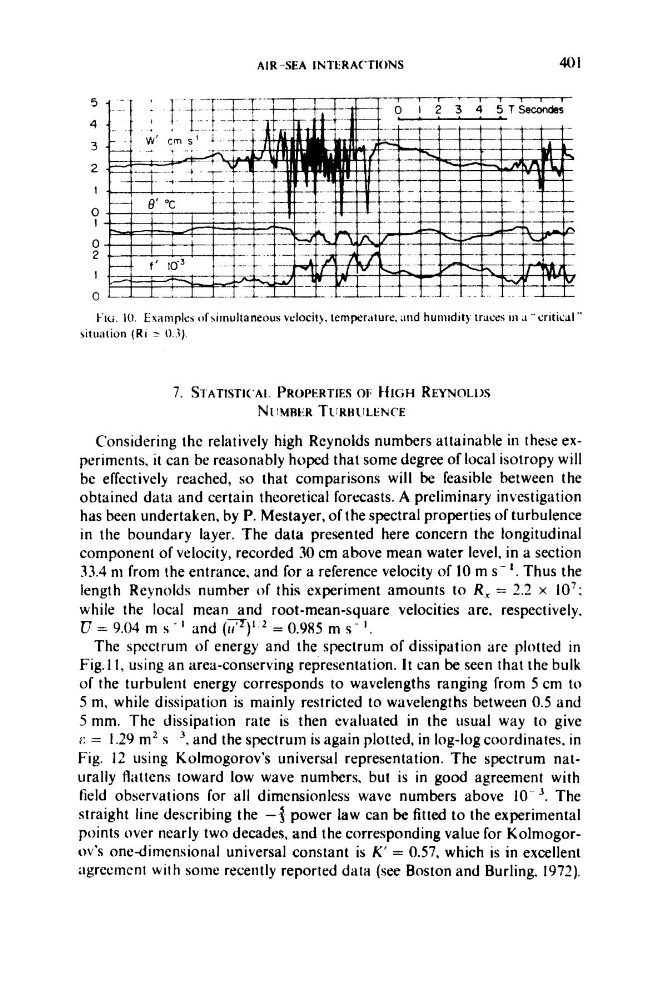
FIG, 10. Examplei of siinultaneous velocii). temperiiture. and humidit) traces in ;I "critical ''
situation ( R i 2 0.3).
7. SI'ATISTIC'AL. PROPERTIES 01; t i l G H REYNOLL)S
Nr I M R E R T ~ I R H L I L E N C E
Considering the relatively high Reynolds numbers attainable in these experiments, it can be reasonably hoped that some degree of local isotropy will
be effectively reached, so that comparisons will be feasible between the
obtained data and certain theoretical forecasts. A preliminary investigation
has been undertaken, by P. Mestayer, of the spectral properties of turbulence
in the boundary layer. The data presented here concern the longitudinal
component of velocity, recorded 30 cm above mean water level, in a section
33.4 ni from the entrance. and for a reference velocity of 10 m s - ' . Thus the
length Reynolds number o f this experiment amounts to R , = 2.2 x 10':
while the local mean and root-mean-square velocities are, respectively.
17 = 9.04 m s - I and (7)'
The spectrum of energy and the spectrum of dissipation are plotted in
Fig.11, using an area-conserving representation. It can be seen that the bulk
of the turbulent energy corresponds to wavelengths ranging from 5 cm to
5 m, while dissipation is mainly restricted to wavelengths between 0.5 and
5 mm. The dissipation rate is then evaluated in the usual way to give
I: = 1.29 m2 s ' , and the spectrum is again plotted, in lop-log coordinates. in
Fig. 12 using Kolmogorov's universal representation. The spectrum naturally flattens toward low wave numbers, but is in good agreement with
field observations for all dimensionless wave numbers above 10. ' . The
straight line describing the -3 power law can be fitted to the experimental
points over ncarly two decades, and the corresponding value for Kolmogorov's one-dimensional universal constant is K' = 0.57. which is in excellent
agreement with somc recently reported data (see Boston and Burling. 1972).
= 0.985 m s- I .
40 1
5
4
3
2
1
0
I
0
2
1
0
FIG, 10. Examplei of siinultaneous velocii). temperiiture. and humidit) traces in ;I "critical ''
situation ( R i 2 0.3).
7. SI'ATISTIC'AL. PROPERTIES 01; t i l G H REYNOLL)S
Nr I M R E R T ~ I R H L I L E N C E
Considering the relatively high Reynolds numbers attainable in these experiments, it can be reasonably hoped that some degree of local isotropy will
be effectively reached, so that comparisons will be feasible between the
obtained data and certain theoretical forecasts. A preliminary investigation
has been undertaken, by P. Mestayer, of the spectral properties of turbulence
in the boundary layer. The data presented here concern the longitudinal
component of velocity, recorded 30 cm above mean water level, in a section
33.4 ni from the entrance. and for a reference velocity of 10 m s - ' . Thus the
length Reynolds number o f this experiment amounts to R , = 2.2 x 10':
while the local mean and root-mean-square velocities are, respectively.
17 = 9.04 m s - I and (7)'
The spectrum of energy and the spectrum of dissipation are plotted in
Fig.11, using an area-conserving representation. It can be seen that the bulk
of the turbulent energy corresponds to wavelengths ranging from 5 cm to
5 m, while dissipation is mainly restricted to wavelengths between 0.5 and
5 mm. The dissipation rate is then evaluated in the usual way to give
I: = 1.29 m2 s ' , and the spectrum is again plotted, in lop-log coordinates. in
Fig. 12 using Kolmogorov's universal representation. The spectrum naturally flattens toward low wave numbers, but is in good agreement with
field observations for all dimensionless wave numbers above 10. ' . The
straight line describing the -3 power law can be fitted to the experimental
points over ncarly two decades, and the corresponding value for Kolmogorov's one-dimensional universal constant is K' = 0.57. which is in excellent
agreement with somc recently reported data (see Boston and Burling. 1972).
= 0.985 m s- I .