

-30
-25
-20
-15
-10
1900
1950
Year
2000
2050
2100
Circulation strength /Sv
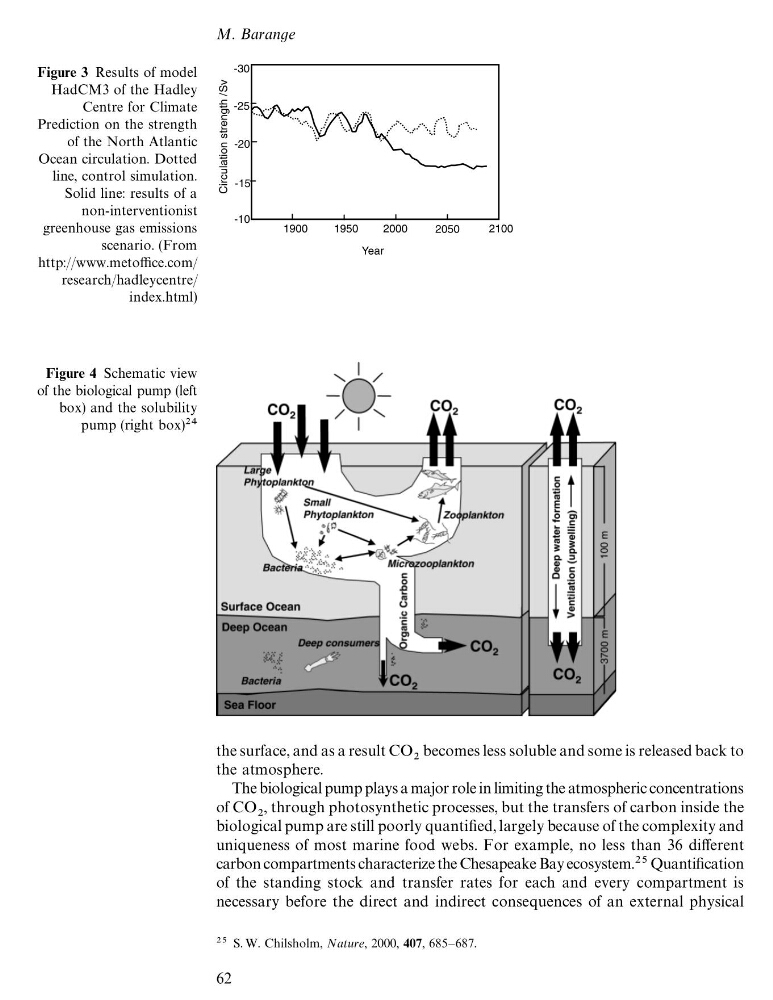
Figure 3 Results of model
HadCM3 of the Hadley
Centre for Climate
Prediction on the strength
of the North Atlantic
Ocean circulation. Dotted
line, control simulation.
Solid line: results of a
non-interventionist
greenhouse gas emissions
scenario. (From
http://www.metoffice.com/
research/hadleycentre/
index.html)
Figure 4 Schematic view
of the biological pump (left
box) and the solubility
pump (right box)
the surface, and as a result CO
becomes less soluble and some is released back to
the atmosphere.
The biological pump plays a major role in limiting the atmospheric concentrations
of CO
, through photosynthetic processes, but the transfers of carbon inside the
biological pump are still poorly quantified, largely because of the complexity and
uniqueness of most marine food webs. For example, no less than 36 different
carbon compartments characterize the Chesapeake Bay ecosystem. Quantification
of the standing stock and transfer rates for each and every compartment is
necessary before the direct and indirect consequences of an external physical
S. W. Chilsholm, Nature, 2000, 407, 685—687.
M. Barange
62
-25
-20
-15
-10
1900
1950
Year
2000
2050
2100
Circulation strength /Sv
Figure 3 Results of model
HadCM3 of the Hadley
Centre for Climate
Prediction on the strength
of the North Atlantic
Ocean circulation. Dotted
line, control simulation.
Solid line: results of a
non-interventionist
greenhouse gas emissions
scenario. (From
http://www.metoffice.com/
research/hadleycentre/
index.html)
Figure 4 Schematic view
of the biological pump (left
box) and the solubility
pump (right box)
the surface, and as a result CO
becomes less soluble and some is released back to
the atmosphere.
The biological pump plays a major role in limiting the atmospheric concentrations
of CO
, through photosynthetic processes, but the transfers of carbon inside the
biological pump are still poorly quantified, largely because of the complexity and
uniqueness of most marine food webs. For example, no less than 36 different
carbon compartments characterize the Chesapeake Bay ecosystem. Quantification
of the standing stock and transfer rates for each and every compartment is
necessary before the direct and indirect consequences of an external physical
S. W. Chilsholm, Nature, 2000, 407, 685—687.
M. Barange
62